The The revenue of Core Lithium (CXO.AX) as of Feb 26, 2026 is 6.51 M AUD. In the previous year, The revenue was -2.42 M AUD — a change of -368.77% (higher).
Core Lithium Revenue
Revenue
6.51 MAUD
YoY
-368.77%
Last updated: Feb 26, 2026
In 2026, Core Lithium's sales reached 6.51 M AUD, a -368.77% difference from the -2.42 M AUD sales recorded in the previous year.
The Core Lithium Revenue history
3 Years
10 Years
25 Years
Max
REVENUE (M AUD)
GROSS MARGIN (%)
Date
REVENUE (M AUD)
GROSS MARGIN (%)
Jan 1, 2010
0
0
Jan 1, 2011
0.13
-33,846
Jan 1, 2012
0.2
-22,000
Jan 1, 2013
0.07
-62,857
Jan 1, 2014
0
0
Jan 1, 2015
0
0
Jan 1, 2016
0
0
Jan 1, 2017
0
0
Jan 1, 2018
0
0
Jan 1, 2019
0
0
Jan 1, 2020
0
0
Jan 1, 2021
0
0
Jan 1, 2022
0
0
Jan 1, 2023
50.6
5,730
Jan 1, 2024
189.49
-1,326
| YEAR | REVENUE (M AUD) | GROSS MARGIN (%) |
|---|---|---|
| 2030 est | 345.31 | -0,13 |
| 2029 est | 292.32 | -0,15 |
| 2028 est | 282.33 | -0,16 |
| 2027 est | 295.67 | -0,15 |
| 2026 est | 6.51 | -6,76 |
| 2025 | -2.42 | 18,17 |
| 2024 | 189.49 | -13,26 |
| 2023 | 50.6 | 57,30 |
| 2022 | - | - |
| 2021 | - | - |
| 2020 | - | - |
| 2019 | - | - |
| 2018 | - | - |
| 2017 | - | - |
| 2016 | - | - |
| 2015 | - | - |
| 2014 | - | - |
| 2013 | 0.07 | -628,57 |
| 2012 | 0.2 | -220,00 |
| 2011 | 0.13 | -338,46 |
| 2010 | - | - |
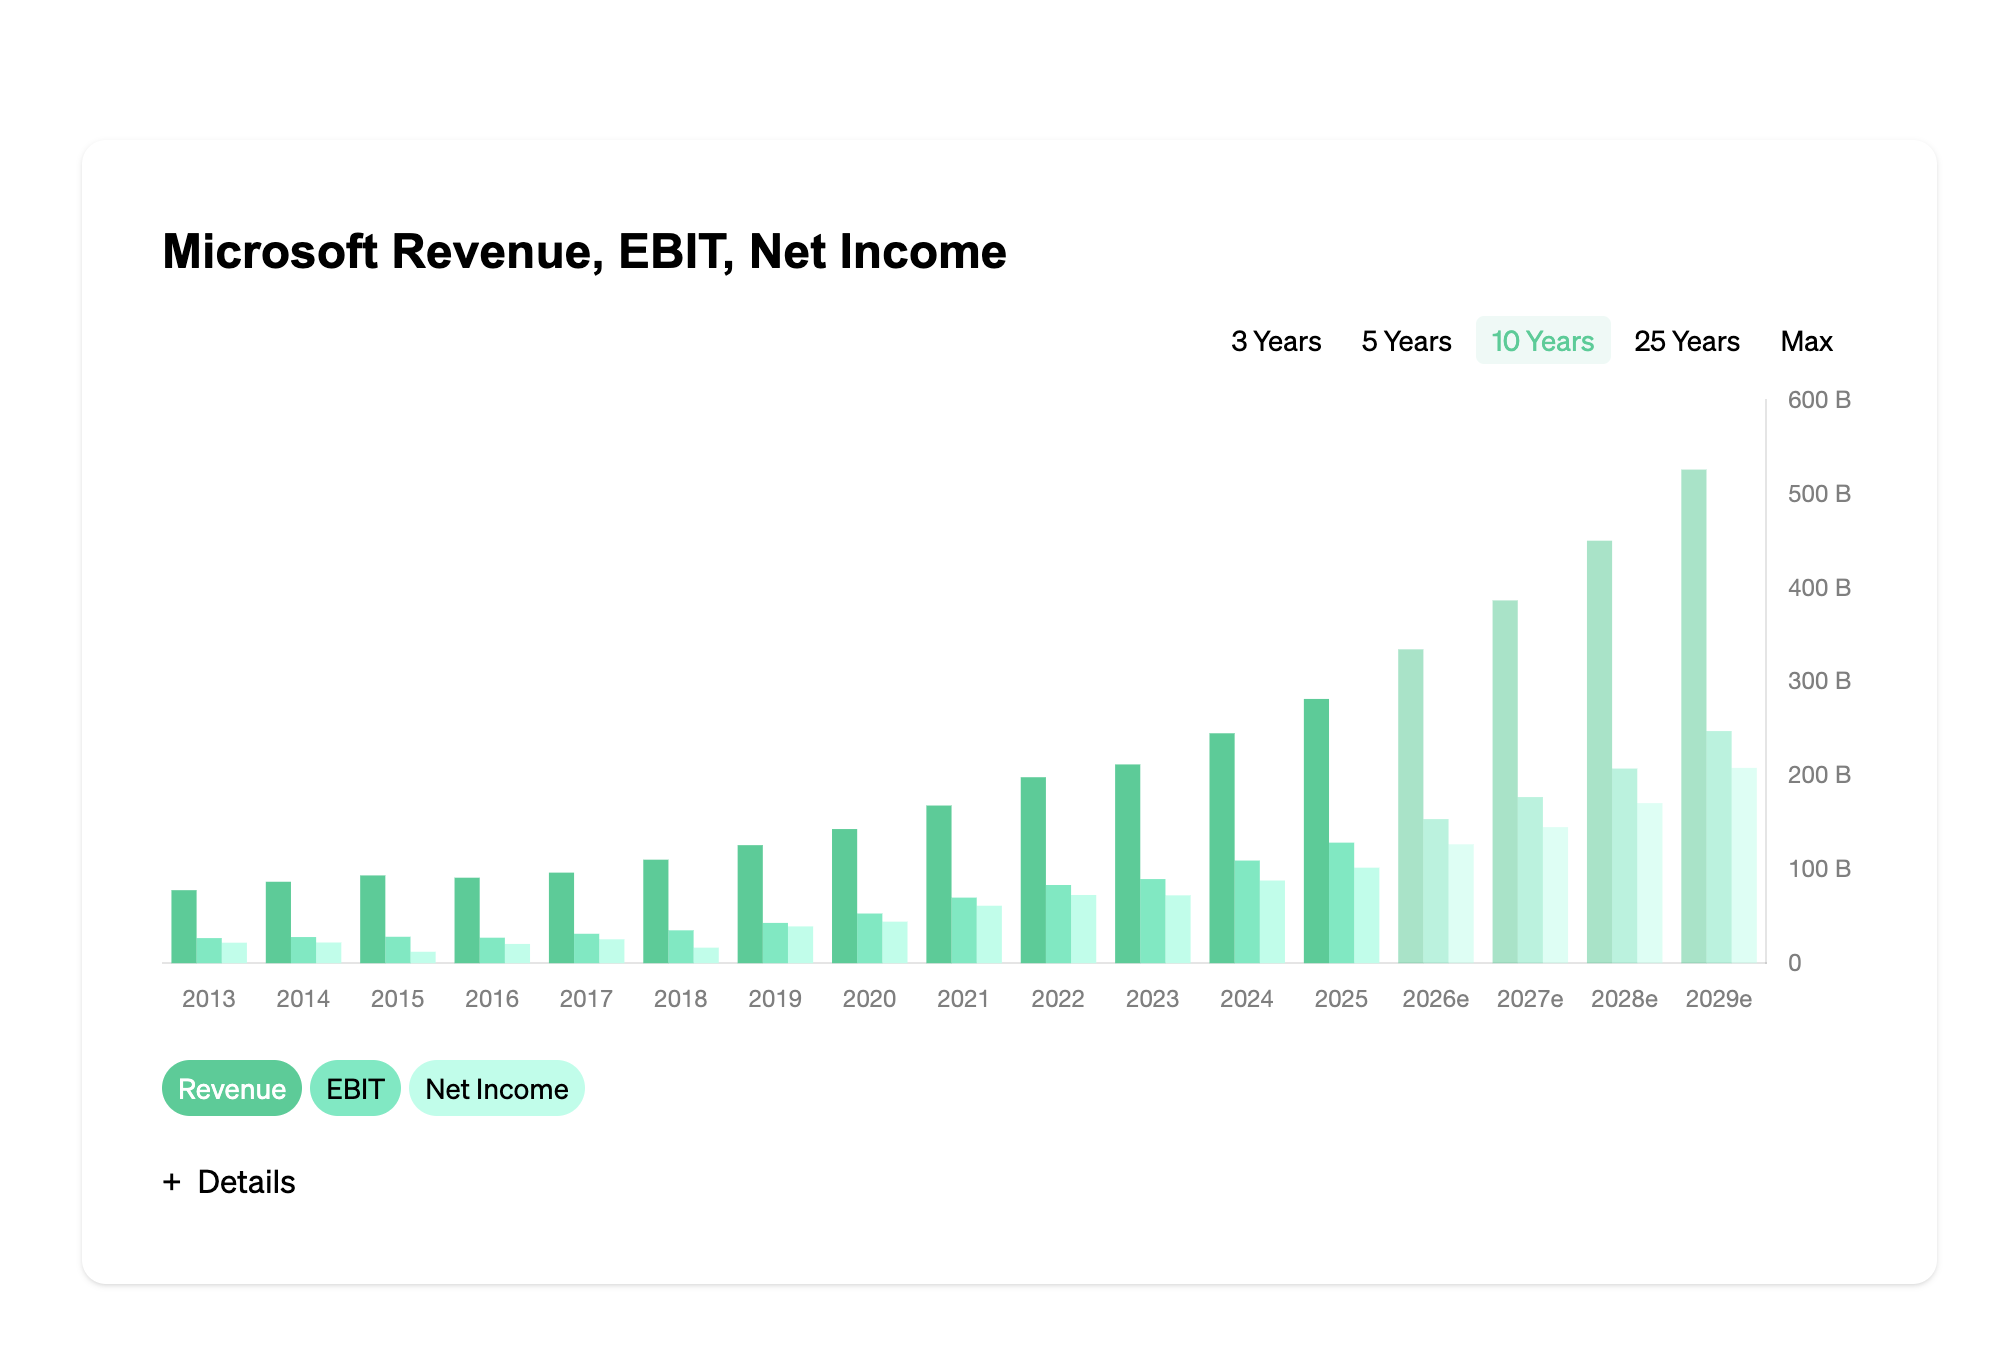
Core Lithium Revenue, EBIT, Net Income
3 Years
5 Years
10 Years
25 Years
Max
Revenue
EBIT
Net Income
Details
Date
Revenue
EBIT
Net Income
Jan 1, 2010
0 AUD
0 AUD
-10,000 AUD
Jan 1, 2011
130,000 AUD
-480,000 AUD
-620,000 AUD
Jan 1, 2012
200,000 AUD
-600,000 AUD
-1.2 M AUD
Jan 1, 2013
70,000 AUD
-820,000 AUD
-1.94 M AUD
Jan 1, 2014
0 AUD
-900,000 AUD
-1.12 M AUD
Jan 1, 2015
0 AUD
-791,500 AUD
-1.27 M AUD
Jan 1, 2016
0 AUD
-972,500 AUD
-1.79 M AUD
Jan 1, 2017
0 AUD
-1.24 M AUD
-1.93 M AUD
Jan 1, 2018
0 AUD
-1.68 M AUD
-2.09 M AUD
Jan 1, 2019
0 AUD
-2.31 M AUD
-2.4 M AUD
Jan 1, 2020
0 AUD
-3.43 M AUD
-4.39 M AUD
Jan 1, 2021
0 AUD
-3.22 M AUD
-2.91 M AUD
Jan 1, 2022
0 AUD
-7.71 M AUD
-7.47 M AUD
Jan 1, 2023
50.6 M AUD
9.79 M AUD
10.81 M AUD
Jan 1, 2024
189.49 M AUD
-51.66 M AUD
-207.01 M AUD
Core Lithium stock margins
The Core Lithium margin analysis displays the gross margin, EBIT margin, as well as the profit margin of Core Lithium. The EBIT margin (EBIT/sales) indicates the percentage of sales that remains as operating profit. The profit margin shows the percentage of sales that remains for Core Lithium.
3 Years
5 Years
10 Years
25 Years
Max
Gross margin
EBIT margin
Profit margin
Details
Date
Gross margin
EBIT margin
Profit margin
Jan 1, 2010
18.17 %
0 %
0 %
Jan 1, 2011
18.17 %
-369.23 %
-476.92 %
Jan 1, 2012
18.17 %
-300 %
-600 %
Jan 1, 2013
18.17 %
-1,171.43 %
-2,771.43 %
Jan 1, 2014
18.17 %
0 %
0 %
Jan 1, 2015
18.17 %
0 %
0 %
Jan 1, 2016
18.17 %
0 %
0 %
Jan 1, 2017
18.17 %
0 %
0 %
Jan 1, 2018
18.17 %
0 %
0 %
Jan 1, 2019
18.17 %
0 %
0 %
Jan 1, 2020
18.17 %
0 %
0 %
Jan 1, 2021
18.17 %
0 %
0 %
Jan 1, 2022
18.17 %
0 %
0 %
Jan 1, 2023
57.3 %
19.35 %
21.36 %
Jan 1, 2024
-13.26 %
-27.26 %
-109.25 %
Core Lithium Stock analysis
What does Core Lithium do? Core Lithium Ltd is an Australian company focused on the extraction of lithium concentrations. The company was founded in 2010 and is headquartered in Darwin, Northern Territory. The company's vision is to become a leading global lithium producer and contribute to the future transformation.
As an emerging company, the main activity of Core Lithium Ltd is lithium extraction. The company owns its own lithium mine in the Northern Territory, Australia, called Finniss Lithium Project. The mine is nearing completion and will be operational in the near future.
The company has a forward-looking business model focused on the growing demand for lithium. The increasing market demand for lithium, mainly due to the growing popularity of electric vehicles, has prompted the company to expand into this industry and enter the lithium processing and production sector.
The various divisions of the company focus on the extraction, production, and delivery of lithium products. The company has not yet launched any products on the market, but it is in the final stages of preparation to soon produce and market lithium carbonate products.
In the Finniss Lithium Project, the company has identified a total of six project areas that potentially contain rich lithium deposits. The project areas include Grants, BP33, Hang Gong, Sandras, Irgon, and Carlton-Lantern. The mine will be capable of producing 180,000 tons of ore per year, with an initial mine life of over 25 years.
Core Lithium Ltd takes pride in being an environmentally conscious company that focuses on sustainable and safe mining practices. The company has prioritized environmental impact and uses only eco-friendly processes to achieve its goals. The company is committed to minimizing the environmental impact on residents and the surrounding ecosystem.
In summary, Core Lithium Ltd is an Australian company focused on lithium extraction. The company has a forward-looking business model aligned with the increasing demand for lithium. It owns its own lithium mine in the Northern Territory, Australia. It has identified six project areas containing potentially rich lithium deposits. The company is committed to applying environmentally friendly processes to minimize environmental impact. The company will soon introduce lithium carbonate products to the market. Core Lithium is one of the most popular companies on Eulerpool.com.
Revenue Details
Understanding Core Lithium's Sales Figures
The sales figures of Core Lithium originate from the total revenue accrued from goods sold or services provided during a specific time period. These numbers are a direct reflection of the company’s ability to translate its products or services into revenue, indicating the demand and market presence.
Year-to-Year Comparison
Analyzing Core Lithium’s yearly sales data offers insights into the company’s growth and stability. An increase in sales suggests a growing demand for its offerings, efficient marketing, or expansion into new markets. Conversely, a decline might indicate market saturation, increased competition, or less effective strategies.
Impact on Investments
Investors often scrutinize Core Lithium's sales data to evaluate its financial health and growth prospects. Consistent sales growth can be a promising indicator of the company’s profitability and potential return on investment, influencing stock prices and investor confidence.
Interpreting Sales Fluctuations
Increases in Core Lithium’s sales indicate market growth, innovation, or effective marketing, often leading to a surge in stock prices. A decline, however, can signal challenges requiring strategic adjustments to enhance market share and profitability.
Frequently Asked Questions about Core Lithium stock
The revenue of Core Lithium amounted to -2.42 M AUD 6.51 M
The revenue in assessing a stock
Revenue is an important financial measure used in the valuation of stocks. It is a measure of a company's economic activity and can serve as an indicator of the company's success. Revenue is considered one of the most important factors in stock valuation. In addition, revenue can also be used to calculate other financial measures such as earnings per share and price-earnings ratio.
History and utilization of revenue
Revenue has long been considered one of the most important financial indicators. It was used in the 19th century as one of the first financial indicators to measure a company's economic activity. Since then, revenue has been regularly used to evaluate companies.
Revenue is usually calculated as a percentage of the company's equity. It can also be used to determine the overall profitability of a company. There are many different types of revenue that can be used to measure a company's economic activity, such as gross revenue, net revenue, and revenue from international business.
The revenue can also be used to evaluate stocks. For example, the revenue of a company can be used to evaluate the success of the company. If a company has high revenue, it means that it is a profitable company because it has high demand for its products or services.
Calculation and Application of Revenue
In order to calculate a company's revenue, the company's income must be deducted from its expenses. The income can come from various sources, such as sales, licensing fees, services, etc. The expenses can include costs for production, procurement, inventory, sales, and administration.
The revenue can then be used to calculate various financial ratios. For example, the revenue can be used to calculate the price-earnings ratio (P/E ratio) of a company. This is a measure of a company's profitability, calculated by taking the ratio of the stock price to earnings per share.
Revenue can also be used to calculate earnings per share (EPS) of a company. This is a measure of a company's profit per share. EPS is calculated by dividing earnings by the number of shares issued.
Use of revenue by investors
Investors use revenue to evaluate stocks, as revenue is an indicator of a company's success. For example, an investor can compare a company's revenue to see how successful it is. An investor can also use a company's revenue to calculate its price-to-earnings ratio and earnings per share.
An example: An investor looks at a company that has a revenue of 25 million euros. He compares this revenue to that of the competitor, which has a revenue of 35 million euros. The investor can then see that the company with 25 million euros in revenue is less successful than the company with 35 million euros in revenue.
Advantages and Disadvantages of Revenue.
Revenue is a very useful tool for valuing stocks as it measures a company's economic activity. Revenue can also be used to calculate other financial ratios such as the price-earnings ratio and earnings per share.
However, one disadvantage is that revenue alone is not a meaningful indicator of a company's success. It is important to consider revenue in comparison to other financial metrics such as earnings per share and price-to-earnings ratio to get a complete picture of the company.
Income Statement — Core Lithium
Stock savings plans offer an attractive way for investors to build wealth over the long term. One of the main advantages is the so-called cost-average effect: by regularly investing a fixed amount in stocks or stock funds, you automatically buy more shares when prices are low, and fewer when they are high. This can lead to a more favorable average price per share over time. In addition, stock savings plans allow small investors access to expensive stocks, as they can participate with small amounts. Regular investment also promotes a disciplined investment strategy and helps to avoid emotional decisions, such as impulsive buying or selling. Furthermore, investors benefit from the potential appreciation of the stocks as well as from dividend distributions, which can be reinvested, enhancing the compounding effect and thus the growth of the invested capital.
All Key Metrics — Core Lithium
Valuation
Income Statement
Margins
Balance Sheet
- Total Assets
- Current Assets
- Cash & Equivalents
- Receivables
- Inventory
- Property, Plant & Equipment
- Goodwill
- Intangible Assets
- Equity
- Liabilities
- Debt
- Current Liabilities
- Long-term Debt
- Short-term Debt
- Retained Earnings
- Book Value per Share
- Tangible Book Value per Share
- Working Capital
- Investments
- Accounts Payable
- Non-Current Assets
- Short-Term Investments
- Long-Term Investments
- Net Debt
- Treasury Stock
- Minority Interest
- Deferred Tax Liabilities
- Net Tangible Assets
- Goodwill/Assets
- Intangibles/Assets
Cash Flow
- Operating Cash Flow
- Capital Expenditures
- Free Cash Flow
- FCF per Share
- Dividends Paid
- Share Buybacks
- Investing Cash Flow
- Financing Cash Flow
- CapEx / Revenue
- Cash Flow per Share
- Stock-Based Compensation
- Change in Working Capital
- Acquisitions (Net)
- Net Change in Cash
- CapEx/OCF
- FCF/Net Income
- FCF Conversion
- Cash Conversion
- Total Shareholder Payout
- CapEx/D&A
Profitability
- ROE
- ROA
- ROCE
- ROIC
- Asset Turnover
- Inventory Turnover
- Receivables Turnover
- Days Sales Outstanding
- Days Inventory Outstanding
- Days Payable Outstanding
- Cash Conversion Cycle
- CROIC
- Gross Profit/Assets
- Fixed Asset Turnover
- Equity Turnover
- Working Capital Turnover
- Payables Turnover
- Capital Intensity
- Receivables/Revenue
- Inventory/Revenue
- EBIT/Assets
Leverage
Growth
- Revenue Growth
- Revenue CAGR 3Y
- Revenue CAGR 5Y
- Revenue CAGR 10Y
- Earnings Growth
- EPS Growth
- EBIT Growth
- EBIT CAGR 3Y
- EBIT CAGR 5Y
- EBIT CAGR 10Y
- Dividend Growth
- FCF Growth
- Book Value Growth
- Earnings CAGR 3Y
- Earnings CAGR 5Y
- Earnings CAGR 10Y
- EPS CAGR 3Y
- EPS CAGR 5Y
- EBITDA Growth YoY
- EBITDA CAGR 3Y
- EBITDA CAGR 5Y
- Gross Profit Growth
- OCF Growth YoY
- Employee Growth
- Dividend CAGR 3Y
- Dividend CAGR 5Y
- Dividend CAGR 10Y
- Asset Growth
- Equity Growth
- Debt Growth
- CapEx Growth
- FCF CAGR 3Y
- FCF CAGR 5Y
- Market Cap Growth
- Share Count Growth