Free Eulerpool Plugin

All charts at Eulerpool are free for everyone, whether private investor, creator, or company. Use high-quality indicators and charts for your own stock analysis or your website. Sharing and using is explicitly desired!

Eulerpool Research Systems
  • 1. iframe
    One line of HTML. Maximum control.
  • 2. WordPress Plugin
    Best for everyone who has a WordPress website. Works easily.

The Eulerpool Revenue Chart of Amazon:

Variant 1: iframe

Fügen Sie an beliebiger Stelle auf Ihrer Webseite folgenden HTML-Code ein, um das entsprechende Eulerpool-Chart darzustellen. Die ISIN US0231351067 as well as the chart type Revenue Chart can be replaced by any other ISIN. All possible chart types:

QuoteChart
daily stock price over the past 20 years
RevenueChart
Revenue, EBIT, and net profit
Revenue per share chart
Revenue, EBIT, and Earnings per share
MarginsChart
Gross margin, EBIT margin, net profit margin
DividendChart
Dividends
Dividend ield Chart
Dividend yield
Payout Ratio Chart
Payout ratio (Dividends / Earnings per Share)
SharesOutstandingChart
Number of outstanding shares
ValuationChart
P/E Ratio, P/S Ratio, and EBIT Multiple

iframe for Stocks:

<iframe class='eulerpool' frameborder='0' scrolling='no' width='100%' height='600' src='https://www.eulerpool.com/chart-api/US0231351067/RevenueChart'></iframe>

Result:

iframe for Crypto:

<iframe class='eulerpool' frameborder='0' scrolling='no' width='100%' height='600' src='https://www.eulerpool.com/chart-api/crypto/BTC--EUR/QuoteChart'></iframe>

Result:

iframe for ETF:

<iframe class='eulerpool' frameborder='0' scrolling='no' width='100%' height='600' src='https://www.eulerpool.com/chart-api/etf/US4642872000/QuoteChart'></iframe>

Result:

iframe for Index:

<iframe class='eulerpool' frameborder='0' scrolling='no' width='100%' height='600' src='https://www.eulerpool.com/chart-api/index/DAX/QuoteChart'></iframe>

Result:

Variation 2: Wordpress Plugin

In the WordPress admin panel, you can find the option to customize the appearance of your website. Here, you can change the colors, fonts, and layout to match your branding and design preferences. Additionally, you can add and remove widgets, customize menus, and manage plugins and themes. To access the admin panel, simply log in to your WordPress account and navigate to the dashboard. From there, you will see a sidebar with various options for customization. Click on the 'Appearance' tab, and you will be able to modify your website's appearance settings. Please note that some features may require additional plugins or themes to be installed. If you need further assistance or have any questions, feel free to contact our support team at support@eulerpool.com. Thank you for choosing Eulerpool for all your stock data needs! Best regards, The Eulerpool Team Plugins ➝ Plugin search for "Eulerpool" and (1) install and then (2) activate.
[] kannst du ganz einfach Daten zu einer einzelnen Aktie in deinen Beitrag einfügen. Der Shortcode erfordert zwei Attribute: "symbol" (das Tickersymbol der Aktie) und "type" (der Typ der angezeigten Daten). Beispiel: [ symbol="AAPL" type="price"] Du kannst aus folgenden Typen wählen: - "price": Aktueller Preis der Aktie - "change": Veränderung des Aktienpreises im Vergleich zum Vortag - "change_percent": Prozentuale Veränderung des Aktienpreises im Vergleich zum Vortag - "high": Höchstpreis der Aktie im aktuellen Handelstag - "low": Tiefstpreis der Aktie im aktuellen Handelstag - "volume": Handelsvolumen der Aktie im aktuellen Handelstag Beispiel: [ symbol="AAPL" type="price"] Du kannst auch spezifizieren, ob die Werte in Form eines absoluten Betrags oder als Prozentwert angezeigt werden sollen. Hierfür kannst du das Attribut "format" verwenden. Beispiel: [ symbol="AAPL" type="change" format="percent"] Diese Shortcodes können auch in Tabellen verwendet werden, um mehrere Aktien gleichzeitig anzuzeigen. Du kannst den Shortcode einfach mehrmals hintereinander verwenden. Beispiel für eine Tabelle: [AlleAktien] | Symbol | Preis | Veränderung | |-------- |------- |------------- | | AAPL | [ symbol="AAPL" type="price"] | [ symbol="AAPL" type="change"] | Diese Tabelle zeigt den aktuellen Preis und die Veränderung des Aktienpreises für das Tickersymbol AAPL an. 
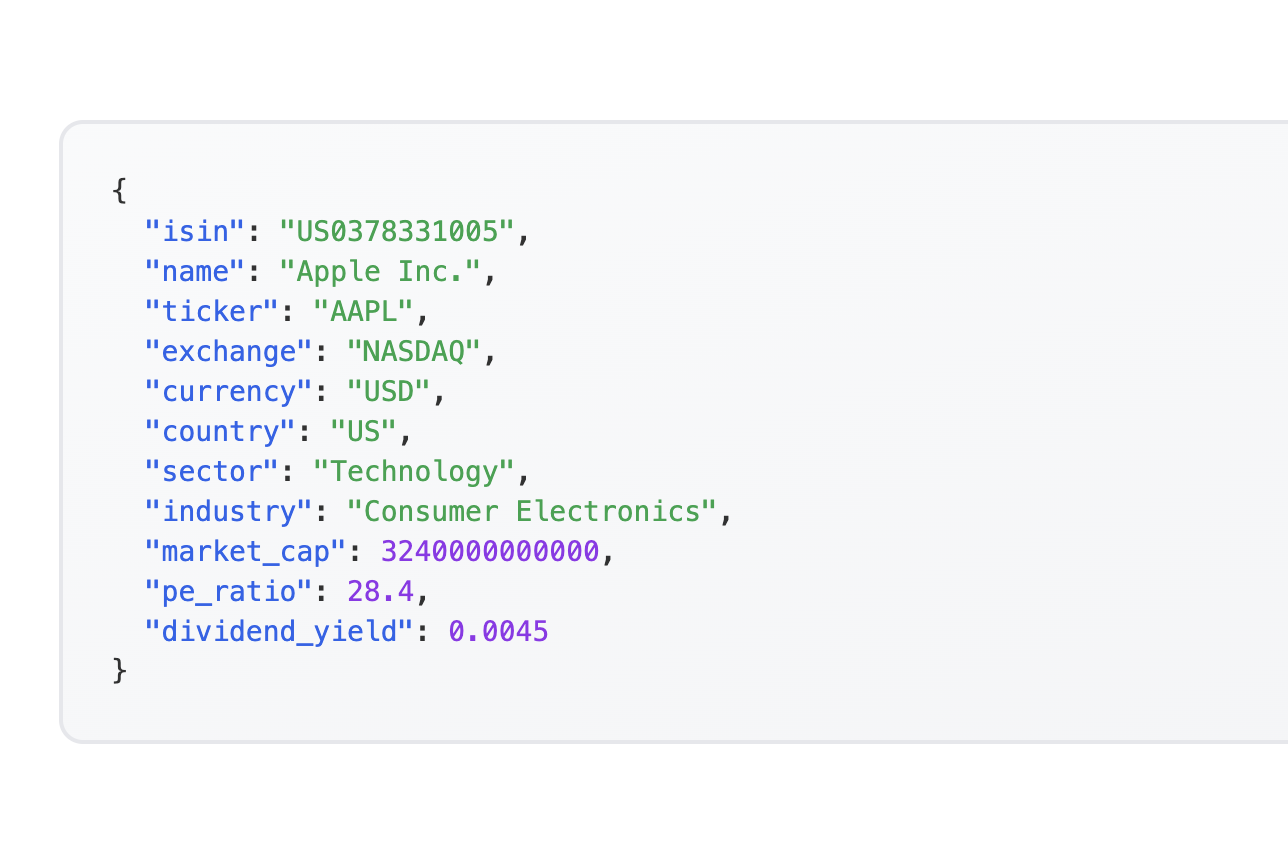
[aaq isin="$isin" chart="$chart"] you can embed charts at the desired location.

Valid parameters for $isin : Each valid 12-digit ISIN. For example US5949181045 (Microsoft).

Valid parameters for $chart :

QuoteChart
daily stock price for the last 20 years
RevenueChart
Revenue, EBIT, and Net Income
Revenue Per Share Chart
Revenue, EBIT (Earnings Before Interest and Taxes), Earnings per Share
MarginsChart
Gross margin, EBIT margin, Net Income margin
Dividend Chart
Dividends
Dividend Yield Chart
Dividend yield
Payout Ratio Chart
Payout Ratio (Dividends / Earnings per Share)
SharesOutstandingChart
Number of outstanding shares
ValuationChart
P/E, P/S, and EBIT-multiple

[aaq isin="US5949181045" chart="QuoteChart"]

Microsoft QuoteChart

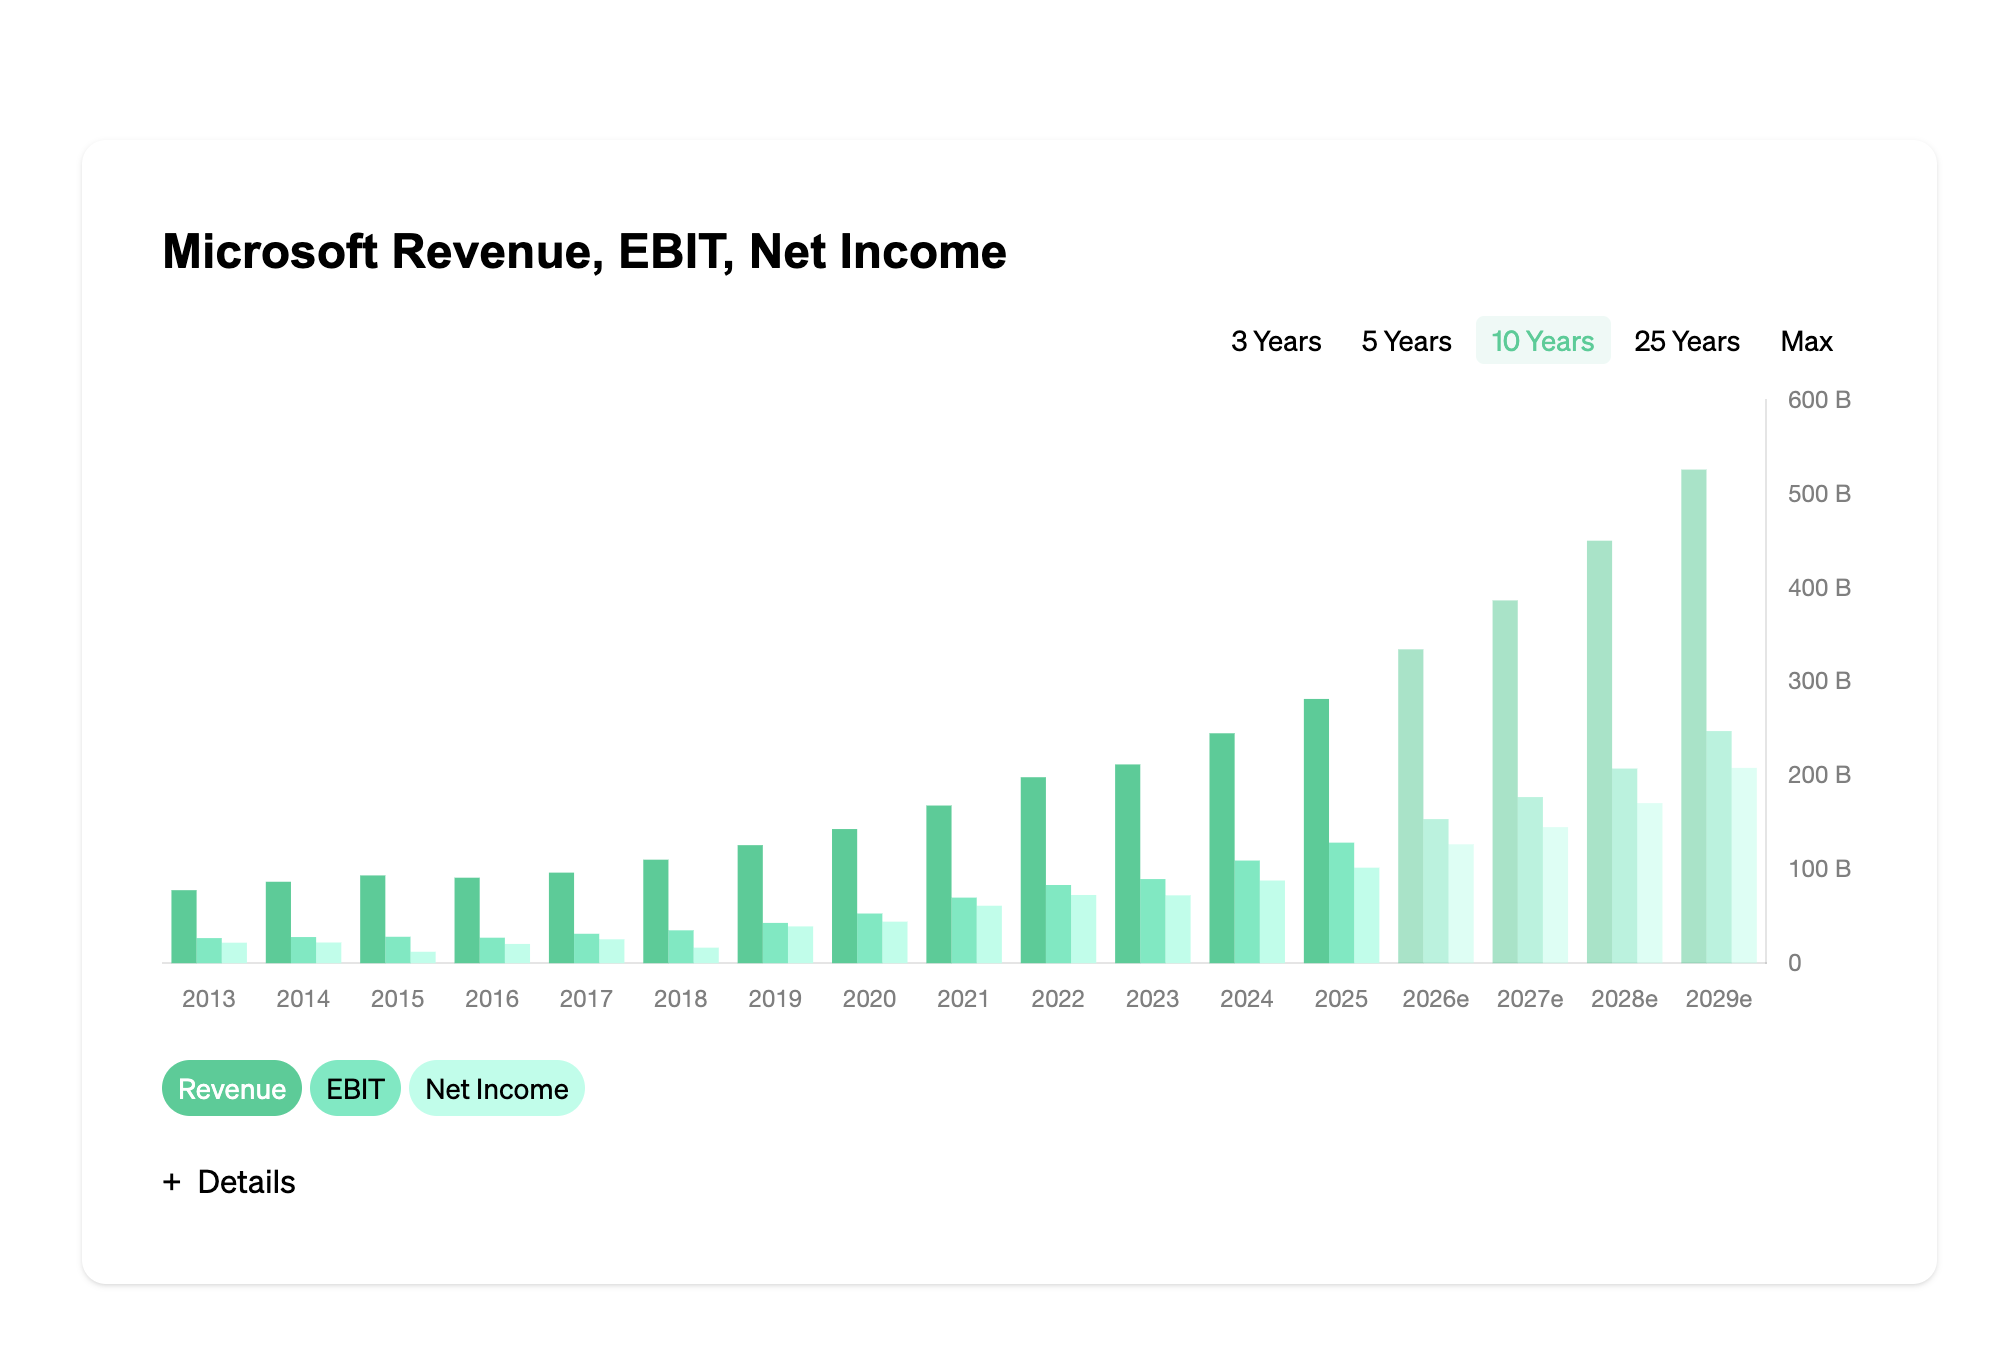
Microsoft RevenueChart

Microsoft RevenuePerShareChart

Microsoft MarginsChart

Microsoft DividendChart

Microsoft DividendYieldChart

Microsoft PayoutRatioChart

Microsoft SharesOutstandingChart

Microsoft Segments Chart

Microsoft ValuationChart

Microsoft FairValueChart

Disclaimer

Graphics, design, and ratios are the property of Eulerpool Research Systems or the respective data providers. As the provider, we reserve the right to update and improve data at any time. Although we carefully review all data points to the best of our knowledge and belief, we cannot guarantee the accuracy of each individual ratio.

Usage rights

The use of graphics, design, and fundamentals is free of charge. Eulerpool Research Systems reserves the right to revoke the usage rights to individual websites (e.g., in case of abuse or suspicion of abuse) without giving reasons. In case of doubt, please inquire with us: info@eulerpool.com.