The The Net Income of Core Lithium (CXO.AX) as of Feb 23, 2026 is -6.49 M AUD. In the previous year, The Net Income was -23.37 M AUD — a change of -72.23% (higher).
Core Lithium Net Income
Net Income
-6.49 MAUD
YoY
-72.23%
Last updated: Feb 23, 2026
In 2026, Core Lithium's profit amounted to -6.49 M AUD, a -72.23% increase from the -23.37 M AUD profit recorded in the previous year.
The Core Lithium Net Income history
3 Years
10 Years
25 Years
Max
NET INCOME (M AUD)
Date
NET INCOME (M AUD)
Jan 1, 2010
-0.01
Jan 1, 2011
-0.62
Jan 1, 2012
-1.2
Jan 1, 2013
-1.94
Jan 1, 2014
-1.12
Jan 1, 2015
-1.27
Jan 1, 2016
-1.79
Jan 1, 2017
-1.93
Jan 1, 2018
-2.09
Jan 1, 2019
-2.4
Jan 1, 2020
-4.39
Jan 1, 2021
-2.91
Jan 1, 2022
-7.47
Jan 1, 2023
10.81
Jan 1, 2024
-207.01
| YEAR | NET INCOME (M AUD) |
|---|---|
| 2030 est | 2.16 |
| 2029 est | 43.05 |
| 2028 est | - |
| 2027 est | 81.12 |
| 2026 est | -6.49 |
| 2025 | -23.37 |
| 2024 | -207.01 |
| 2023 | 10.81 |
| 2022 | -7.47 |
| 2021 | -2.91 |
| 2020 | -4.39 |
| 2019 | -2.4 |
| 2018 | -2.09 |
| 2017 | -1.93 |
| 2016 | -1.79 |
| 2015 | -1.27 |
| 2014 | -1.12 |
| 2013 | -1.94 |
| 2012 | -1.2 |
| 2011 | -0.62 |
| 2010 | -0.01 |
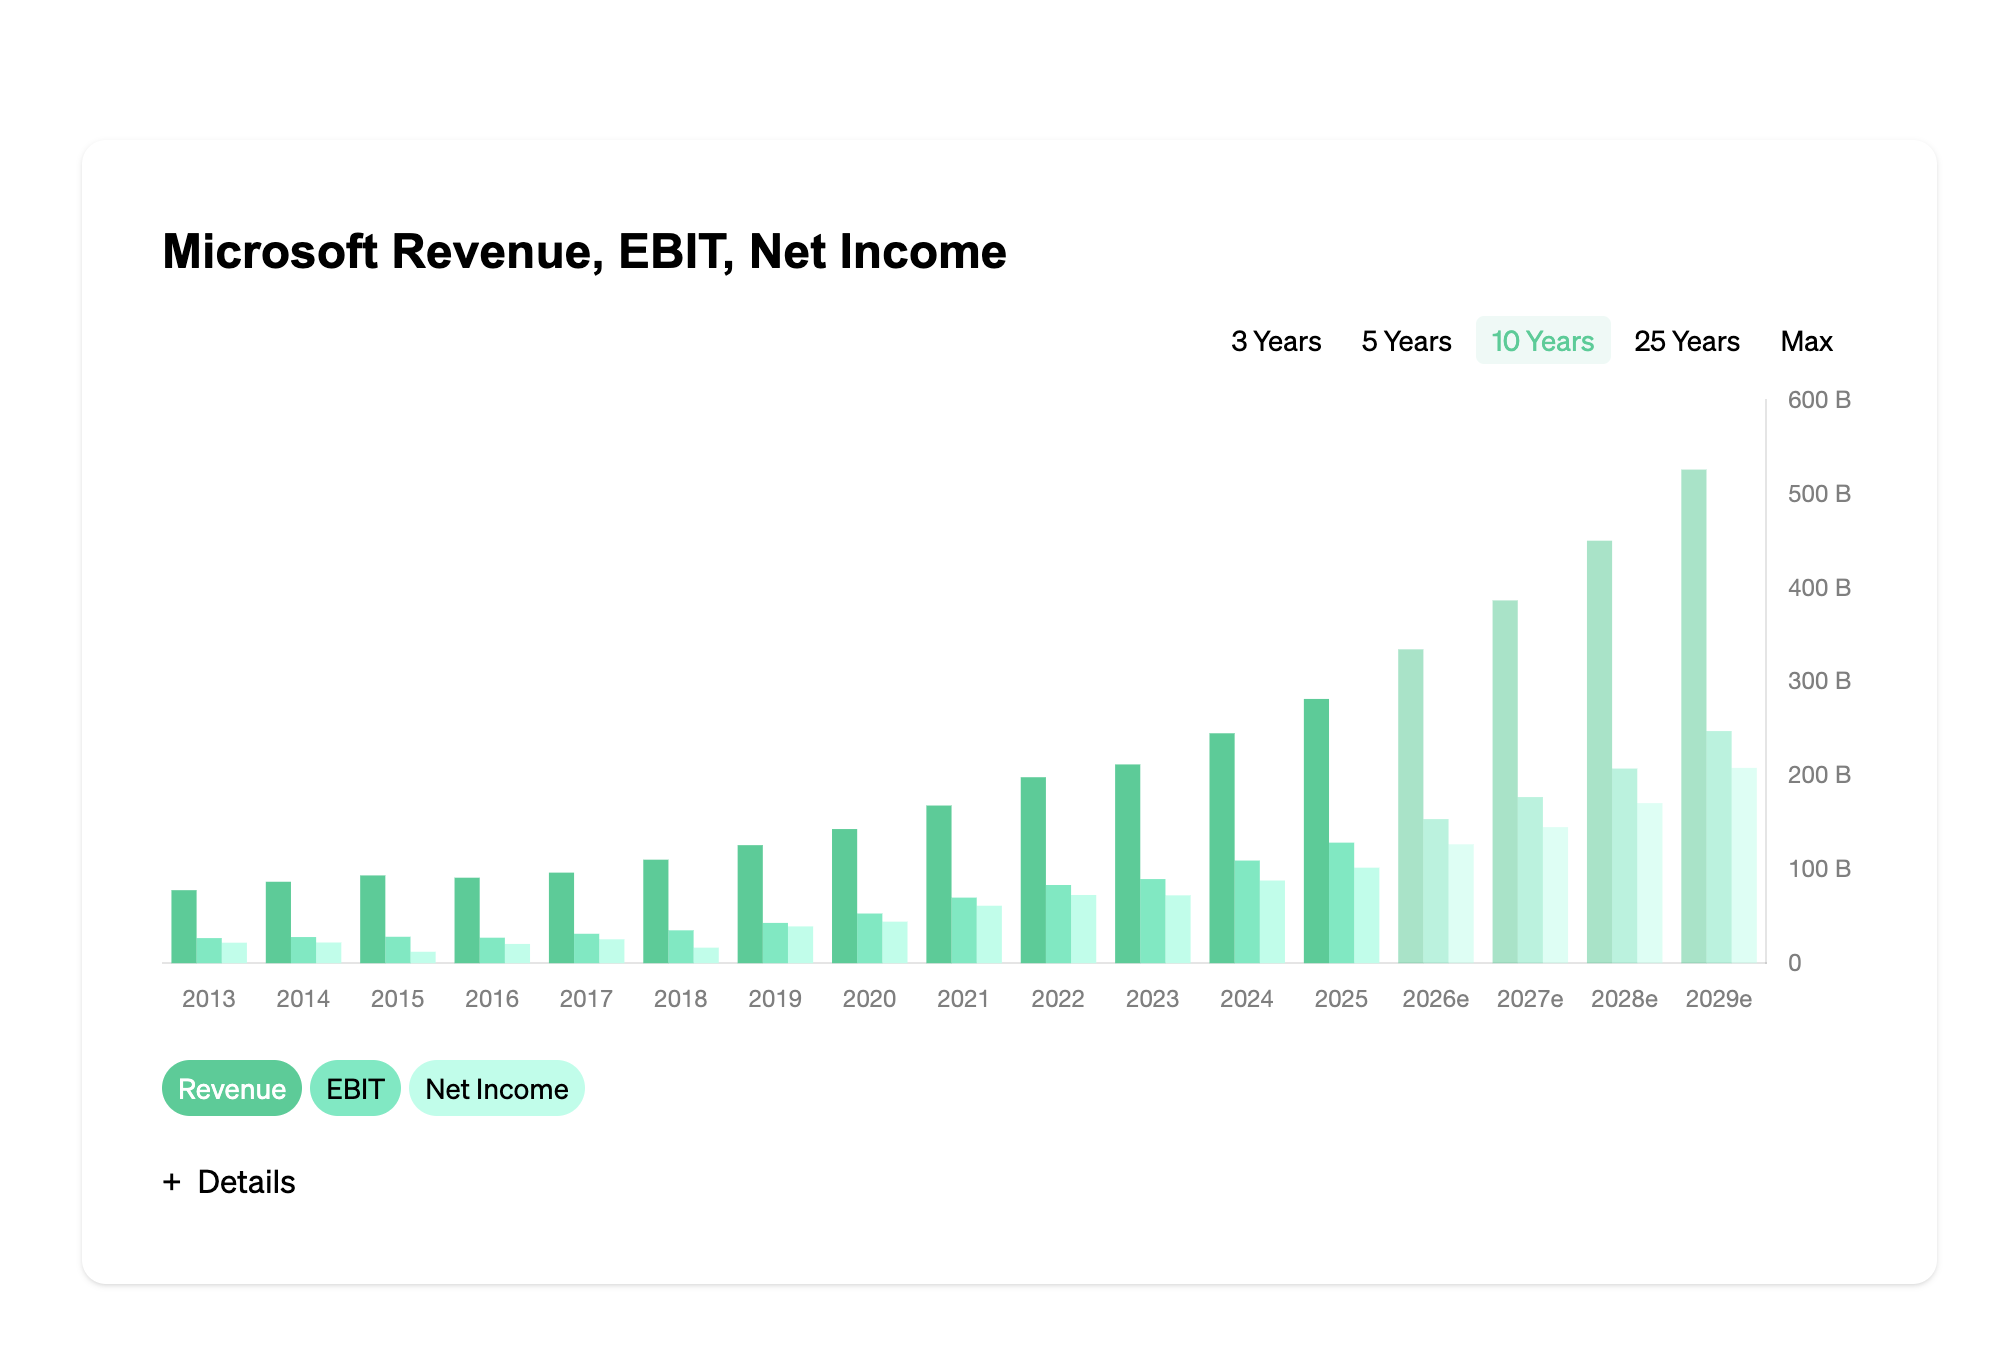
Core Lithium Revenue, EBIT, Net Income
3 Years
5 Years
10 Years
25 Years
Max
Revenue
EBIT
Net Income
Details
Date
Revenue
EBIT
Net Income
Jan 1, 2010
0 AUD
0 AUD
-10,000 AUD
Jan 1, 2011
130,000 AUD
-480,000 AUD
-620,000 AUD
Jan 1, 2012
200,000 AUD
-600,000 AUD
-1.2 M AUD
Jan 1, 2013
70,000 AUD
-820,000 AUD
-1.94 M AUD
Jan 1, 2014
0 AUD
-900,000 AUD
-1.12 M AUD
Jan 1, 2015
0 AUD
-791,500 AUD
-1.27 M AUD
Jan 1, 2016
0 AUD
-972,500 AUD
-1.79 M AUD
Jan 1, 2017
0 AUD
-1.24 M AUD
-1.93 M AUD
Jan 1, 2018
0 AUD
-1.68 M AUD
-2.09 M AUD
Jan 1, 2019
0 AUD
-2.31 M AUD
-2.4 M AUD
Jan 1, 2020
0 AUD
-3.43 M AUD
-4.39 M AUD
Jan 1, 2021
0 AUD
-3.22 M AUD
-2.91 M AUD
Jan 1, 2022
0 AUD
-7.71 M AUD
-7.47 M AUD
Jan 1, 2023
50.6 M AUD
9.79 M AUD
10.81 M AUD
Jan 1, 2024
189.49 M AUD
-51.66 M AUD
-207.01 M AUD
Core Lithium stock margins
The Core Lithium margin analysis displays the gross margin, EBIT margin, as well as the profit margin of Core Lithium. The EBIT margin (EBIT/sales) indicates the percentage of sales that remains as operating profit. The profit margin shows the percentage of sales that remains for Core Lithium.
3 Years
5 Years
10 Years
25 Years
Max
Gross margin
EBIT margin
Profit margin
Details
Date
Gross margin
EBIT margin
Profit margin
Jan 1, 2010
18.17 %
0 %
0 %
Jan 1, 2011
18.17 %
-369.23 %
-476.92 %
Jan 1, 2012
18.17 %
-300 %
-600 %
Jan 1, 2013
18.17 %
-1,171.43 %
-2,771.43 %
Jan 1, 2014
18.17 %
0 %
0 %
Jan 1, 2015
18.17 %
0 %
0 %
Jan 1, 2016
18.17 %
0 %
0 %
Jan 1, 2017
18.17 %
0 %
0 %
Jan 1, 2018
18.17 %
0 %
0 %
Jan 1, 2019
18.17 %
0 %
0 %
Jan 1, 2020
18.17 %
0 %
0 %
Jan 1, 2021
18.17 %
0 %
0 %
Jan 1, 2022
18.17 %
0 %
0 %
Jan 1, 2023
57.3 %
19.35 %
21.36 %
Jan 1, 2024
-13.26 %
-27.26 %
-109.25 %
Core Lithium Stock analysis
What does Core Lithium do? Core Lithium Ltd is an Australian company focused on the extraction of lithium concentrations. The company was founded in 2010 and is headquartered in Darwin, Northern Territory. The company's vision is to become a leading global lithium producer and contribute to the future transformation.
As an emerging company, the main activity of Core Lithium Ltd is lithium extraction. The company owns its own lithium mine in the Northern Territory, Australia, called Finniss Lithium Project. The mine is nearing completion and will be operational in the near future.
The company has a forward-looking business model focused on the growing demand for lithium. The increasing market demand for lithium, mainly due to the growing popularity of electric vehicles, has prompted the company to expand into this industry and enter the lithium processing and production sector.
The various divisions of the company focus on the extraction, production, and delivery of lithium products. The company has not yet launched any products on the market, but it is in the final stages of preparation to soon produce and market lithium carbonate products.
In the Finniss Lithium Project, the company has identified a total of six project areas that potentially contain rich lithium deposits. The project areas include Grants, BP33, Hang Gong, Sandras, Irgon, and Carlton-Lantern. The mine will be capable of producing 180,000 tons of ore per year, with an initial mine life of over 25 years.
Core Lithium Ltd takes pride in being an environmentally conscious company that focuses on sustainable and safe mining practices. The company has prioritized environmental impact and uses only eco-friendly processes to achieve its goals. The company is committed to minimizing the environmental impact on residents and the surrounding ecosystem.
In summary, Core Lithium Ltd is an Australian company focused on lithium extraction. The company has a forward-looking business model aligned with the increasing demand for lithium. It owns its own lithium mine in the Northern Territory, Australia. It has identified six project areas containing potentially rich lithium deposits. The company is committed to applying environmentally friendly processes to minimize environmental impact. The company will soon introduce lithium carbonate products to the market. Core Lithium is one of the most popular companies on Eulerpool.com.
Net Income Details
Understanding Core Lithium's Profit Margins
The profit margins of Core Lithium represent the net income earned after deducting all operational expenses, costs, and taxes from the revenue. This figure is a clear indicator of Core Lithium's financial health, operational efficiency, and profitability. Higher profit margins signify better cost management and income generation capabilities.
Year-to-Year Comparison
Evaluating Core Lithium's profit on a yearly basis can offer significant insights into its financial growth, stability, and trends. A consistent increase in profit suggests improved operational efficiency, cost management, or increased revenue, while a decrease may indicate rising costs, declining sales, or operational challenges.
Impact on Investments
Core Lithium's profit figures are critical for investors who are aiming to understand the company's financial standing and future growth prospects. Increased profits often lead to higher stock valuations, boosting investor confidence and attracting more investments.
Interpreting Profit Fluctuations
When Core Lithium’s profit increases, it often indicates enhanced operational efficiency or increased sales. In contrast, a decline in profit can signal operational inefficiencies, increased costs, or competitive pressures, necessitating strategic interventions to boost profitability.
Frequently Asked Questions about Core Lithium stock
Core Lithium has made -6.49 M AUD this year.
Stock savings plans offer an attractive way for investors to build wealth over the long term. One of the main advantages is the so-called cost-average effect: by regularly investing a fixed amount in stocks or stock funds, you automatically buy more shares when prices are low, and fewer when they are high. This can lead to a more favorable average price per share over time. In addition, stock savings plans allow small investors access to expensive stocks, as they can participate with small amounts. Regular investment also promotes a disciplined investment strategy and helps to avoid emotional decisions, such as impulsive buying or selling. Furthermore, investors benefit from the potential appreciation of the stocks as well as from dividend distributions, which can be reinvested, enhancing the compounding effect and thus the growth of the invested capital.
Other KPIs of Core Lithium
Our stock analysis for Core Lithium Revenue stock includes important financial indicators such as revenue, profit, P/E ratio, P/S ratio, EBIT, as well as information on dividends. We also assess aspects such as stocks, market capitalization, debt, equity, and liabilities of Core Lithium Revenue. If you are looking for more detailed information on these topics, we offer comprehensive analyses on our subpages.