The (Price-Sales Ratio) is an important metric for stock valuation. It is calculated by dividing the current share price by the revenue per share. The P/S indicates how many years a company needs to generate the revenue per share as profit. A low P/S suggests that a stock may be undervalued, while a high P/S could indicate overvaluation. However, it is important to always consider the P/S in the context of the industry and the company. of Core Lithium (CXO.AX) as of Feb 27, 2026 is -234.43. In the previous year, (Price-Sales Ratio) is an important metric for stock valuation. It is calculated by dividing the current share price by the revenue per share. The P/S indicates how many years a company needs to generate the revenue per share as profit. A low P/S suggests that a stock may be undervalued, while a high P/S could indicate overvaluation. However, it is important to always consider the P/S in the context of the industry and the company. was -243.27 — a change of -3.63% (higher).
Core Lithium P/S
P/S
-234.43
YoY
-3.63%
Last updated: Feb 27, 2026
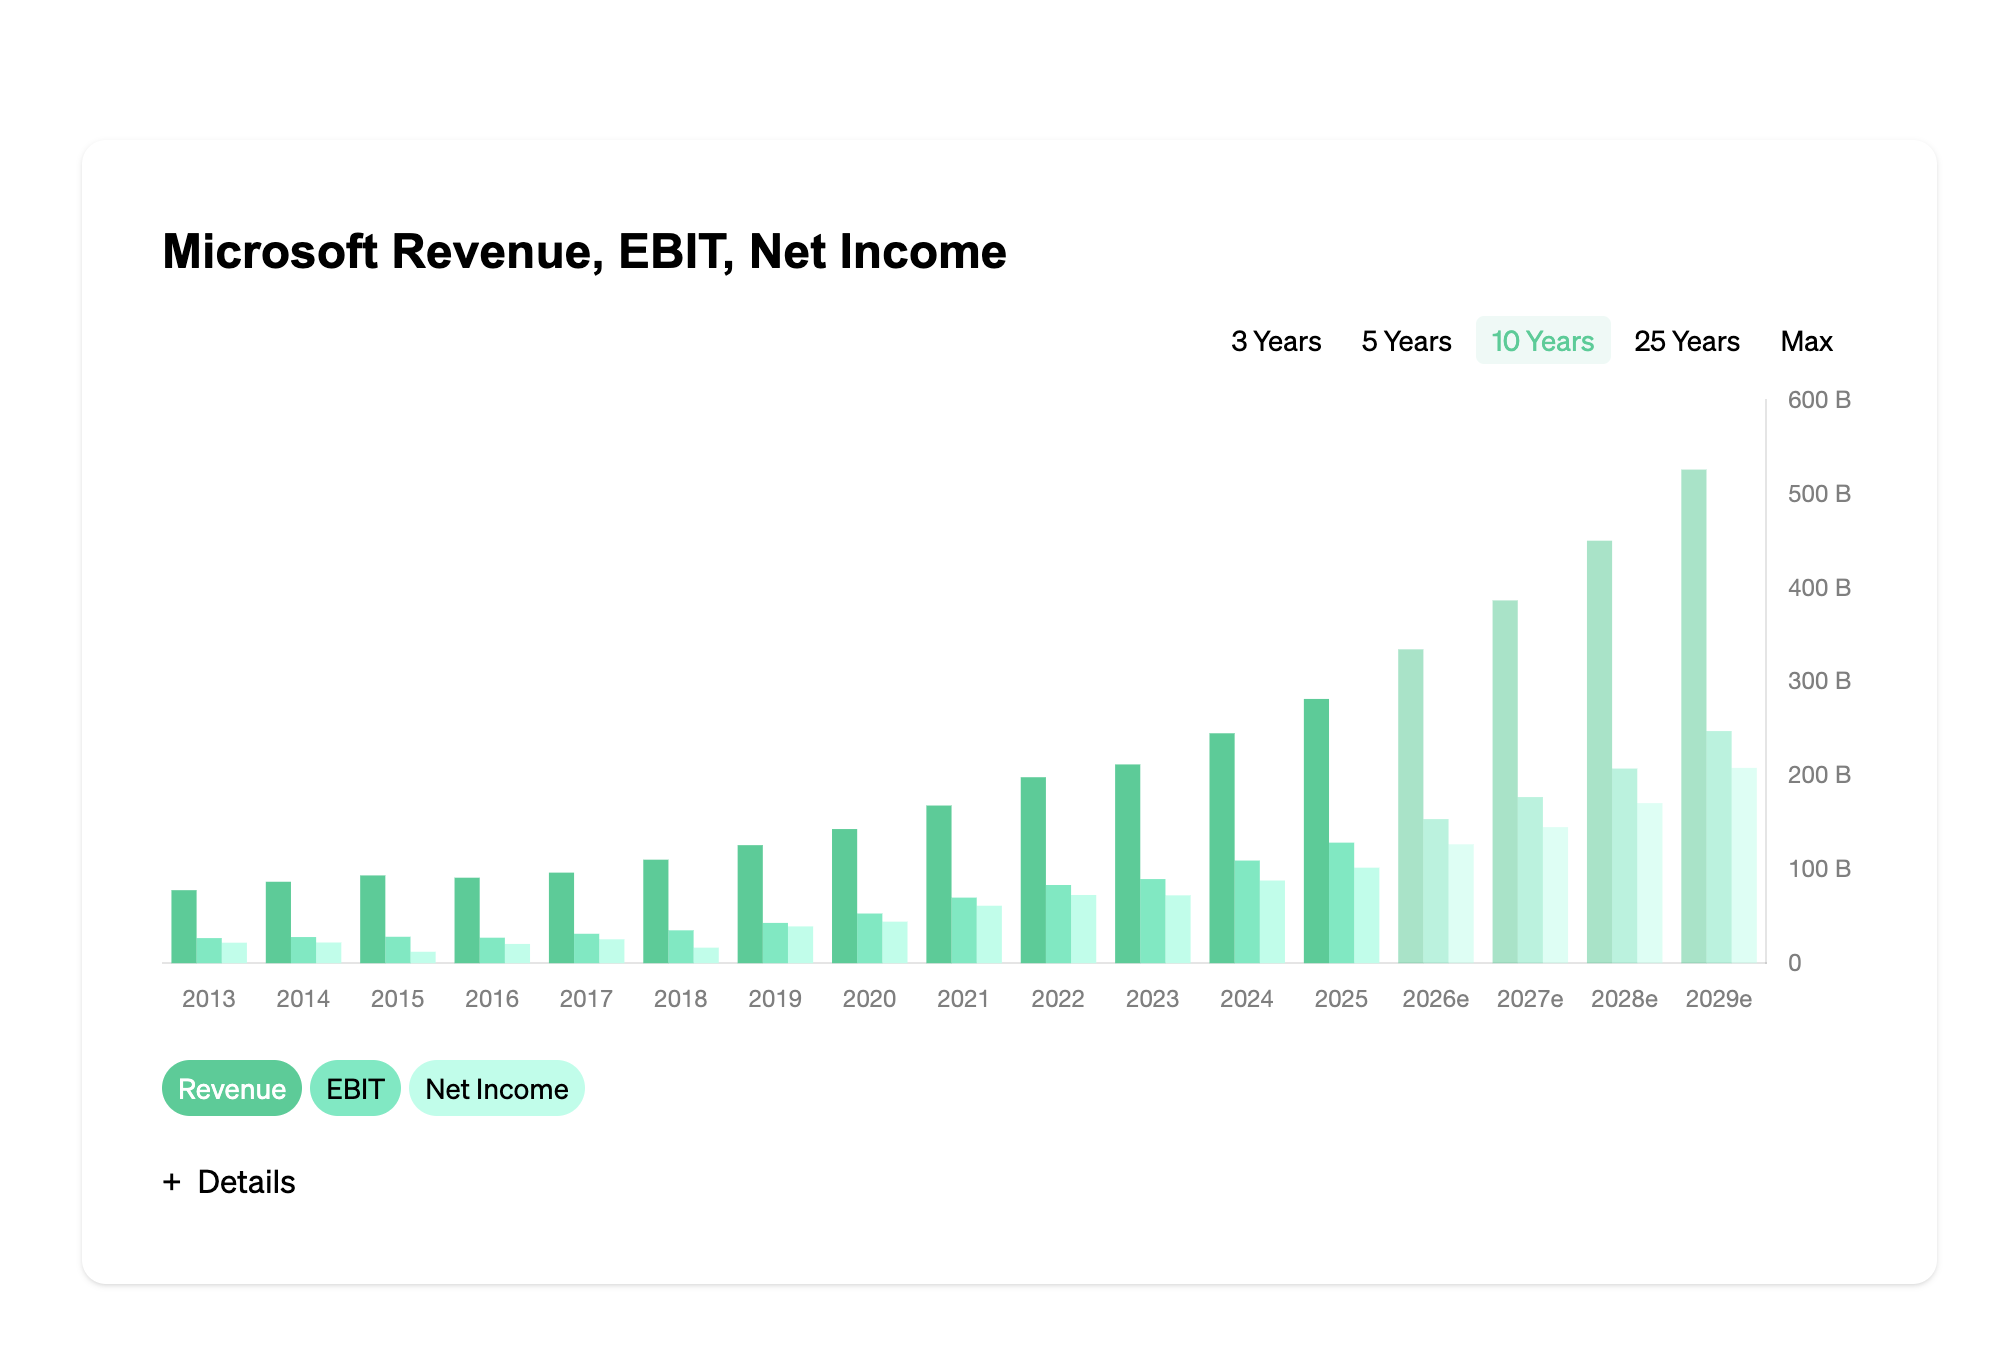
The Core Lithium P/S history
Core Lithium Stock analysis
P/S Details
Decoding Core Lithium's P/S Ratio
Core Lithium's Price to Sales (P/S) Ratio is a crucial financial metric that measures the company's market valuation relative to its total sales revenue. It's calculated by dividing the company's market capitalization by its total sales over a specific period. A lower P/S ratio can indicate that the company is undervalued, while a higher ratio may suggest overvaluation.
Year-to-Year Comparison
Comparing Core Lithium's P/S ratio yearly provides insights into how the market perceives the company’s value relative to its sales. An increasing ratio over time can indicate growing investor confidence, while a decreasing trend might reflect concerns about the company’s revenue generation capabilities or market conditions.
Impact on Investments
The P/S ratio is instrumental for investors evaluating Core Lithium's stock. It offers insights into the company’s efficiency in generating sales and its market valuation. Investors use this ratio to compare similar companies within the same industry, aiding in selecting stocks that offer the best value for investment.
Interpreting P/S Ratio Fluctuations
Variations in Core Lithium’s P/S ratio can result from changes in the stock price, sales revenue, or both. Understanding these fluctuations is crucial for investors to evaluate the company’s current valuation and future growth potential, aligning their investment strategies accordingly.
Frequently Asked Questions about Core Lithium stock
(Price-Sales Ratio) is an important metric for stock valuation. It is calculated by dividing the current share price by the revenue per share. The P/S indicates how many years a company needs to generate the revenue per share as profit. A low P/S suggests that a stock may be undervalued, while a high P/S could indicate overvaluation. However, it is important to always consider the P/S in the context of the industry and the company. of Core Lithium amounted to -243.27 -234.43
The P/S ratio when valuing a stock.
The price-to-sales ratio (P/S ratio) is an important tool of technical analysis that assists investors in evaluating stocks. It refers to the earnings per share of a company and its price movements. This indicator can be used to determine a stock's fair value, relative to the company's earnings.
History of the Price-to-Sales Ratio
The price-to-sales ratio is a relatively new indicator. It was first used in the 1980s by John Price when he developed the Price-to-Sales Index (PSI). Price wanted to find a way to value stocks taking into account their earnings. He noticed that many stock prices were not in line with their earnings situation. The PSI has since become an important analytical tool and is often referred to as the P/S ratio.
Calculation of the price-to-sales ratio
The price-to-sales ratio is easy to calculate. It is determined by dividing the current stock price by the company's earnings per share. P/S ratio = Stock price / Earnings per share. For example, if a company's stock price is $10 and the earnings per share is $2, then the P/S ratio is 5.
Application of the Price-to-Sales Ratio
The Price-to-Sales ratio is a useful tool for determining a fairly valued stock price. A low P/S ratio may indicate that a stock price is undervalued, which could be a good entry opportunity. However, a high Price-to-Sales ratio may indicate that a stock price is overvalued and investors should exercise caution.
An example: A company has a stock price of 20 USD and an earnings per share of 2 USD. The P/E ratio is 10. This could indicate that the stock price is overvalued and investors should be cautious before buying.
Investors and the price-to-sales ratio
Investors use the price-to-sales ratio to determine whether a company's stock price is fairly valued or not. They can compare the P/S ratio to see how the stock price relates to the company's earnings. Investors can also observe the P/S ratio over a longer period of time to see if the stock price changes in relation to the company's earnings.
Advantages and Disadvantages of the Price-to-Sales Ratio
The greatest advantage of the price-to-sales ratio is that it is a simple and understandable tool to determine the fair value of a stock price. It can also help investors identify stocks that are undervalued. One disadvantage is that the P/S ratio does not provide information about the company's profits. Therefore, investors should also consider other financial ratios before investing.
In today's time, the price-to-sales ratio is an important tool for investors to evaluate stocks and identify potential investment opportunities. It can help find a fairly valued stock price and identify stocks that are undervalued. However, investors should also consider other financial indicators before making an investment decision.
Valuation — Core Lithium
All Key Metrics — Core Lithium
Valuation
Income Statement
Margins
Balance Sheet
- Total Assets
- Current Assets
- Cash & Equivalents
- Receivables
- Inventory
- Property, Plant & Equipment
- Goodwill
- Intangible Assets
- Equity
- Liabilities
- Debt
- Current Liabilities
- Long-term Debt
- Short-term Debt
- Retained Earnings
- Book Value per Share
- Tangible Book Value per Share
- Working Capital
- Investments
- Accounts Payable
- Non-Current Assets
- Short-Term Investments
- Long-Term Investments
- Net Debt
- Treasury Stock
- Minority Interest
- Deferred Tax Liabilities
- Net Tangible Assets
- Goodwill/Assets
- Intangibles/Assets
Cash Flow
- Operating Cash Flow
- Capital Expenditures
- Free Cash Flow
- FCF per Share
- Dividends Paid
- Share Buybacks
- Investing Cash Flow
- Financing Cash Flow
- CapEx / Revenue
- Cash Flow per Share
- Stock-Based Compensation
- Change in Working Capital
- Acquisitions (Net)
- Net Change in Cash
- CapEx/OCF
- FCF/Net Income
- FCF Conversion
- Cash Conversion
- Total Shareholder Payout
- CapEx/D&A
Profitability
- ROE
- ROA
- ROCE
- ROIC
- Asset Turnover
- Inventory Turnover
- Receivables Turnover
- Days Sales Outstanding
- Days Inventory Outstanding
- Days Payable Outstanding
- Cash Conversion Cycle
- CROIC
- Gross Profit/Assets
- Fixed Asset Turnover
- Equity Turnover
- Working Capital Turnover
- Payables Turnover
- Capital Intensity
- Receivables/Revenue
- Inventory/Revenue
- EBIT/Assets
Leverage
Growth
- Revenue Growth
- Revenue CAGR 3Y
- Revenue CAGR 5Y
- Revenue CAGR 10Y
- Earnings Growth
- EPS Growth
- EBIT Growth
- EBIT CAGR 3Y
- EBIT CAGR 5Y
- EBIT CAGR 10Y
- Dividend Growth
- FCF Growth
- Book Value Growth
- Earnings CAGR 3Y
- Earnings CAGR 5Y
- Earnings CAGR 10Y
- EPS CAGR 3Y
- EPS CAGR 5Y
- EBITDA Growth YoY
- EBITDA CAGR 3Y
- EBITDA CAGR 5Y
- Gross Profit Growth
- OCF Growth YoY
- Employee Growth
- Dividend CAGR 3Y
- Dividend CAGR 5Y
- Dividend CAGR 10Y
- Asset Growth
- Equity Growth
- Debt Growth
- CapEx Growth
- FCF CAGR 3Y
- FCF CAGR 5Y
- Market Cap Growth
- Share Count Growth