


Silver Lake Resources Stock SLR.AX
Price
Silver Lake Resources stock price
Details
Price
ⓘOverview
The Quote Chart provides detailed and dynamic insights into the Silver Lake Resources stock's performance, showcasing daily, weekly, or monthly aggregated quotes. Users can switch between different time frames to analyze the stock's progression meticulously and make informed investment decisions.
Intraday Feature
The intraday feature provides real-time data, allowing investors to view the Silver Lake Resources stock’s price fluctuations within the trading day, facilitating timely and strategic investment decisions.
Total Return and Relative Price Change
View the total return of the Silver Lake Resources stock to gauge its profitability over time. The relative price change, based on the first quote available in the selected timeframe, offers insights into the stock’s performance, assisting in evaluating its investment potential.
Interpretation and Investment
Utilize the comprehensive data presented in the Quote Chart to analyze Silver Lake Resources's market trends, price movements, and potential returns. Make informed investment choices by comparing different time frames and evaluating intraday data for optimized portfolio management.
| Date | Silver Lake Resources Price |
|---|---|
| 6/7/2024 | 1.54 AUD |
| 6/6/2024 | 1.55 AUD |
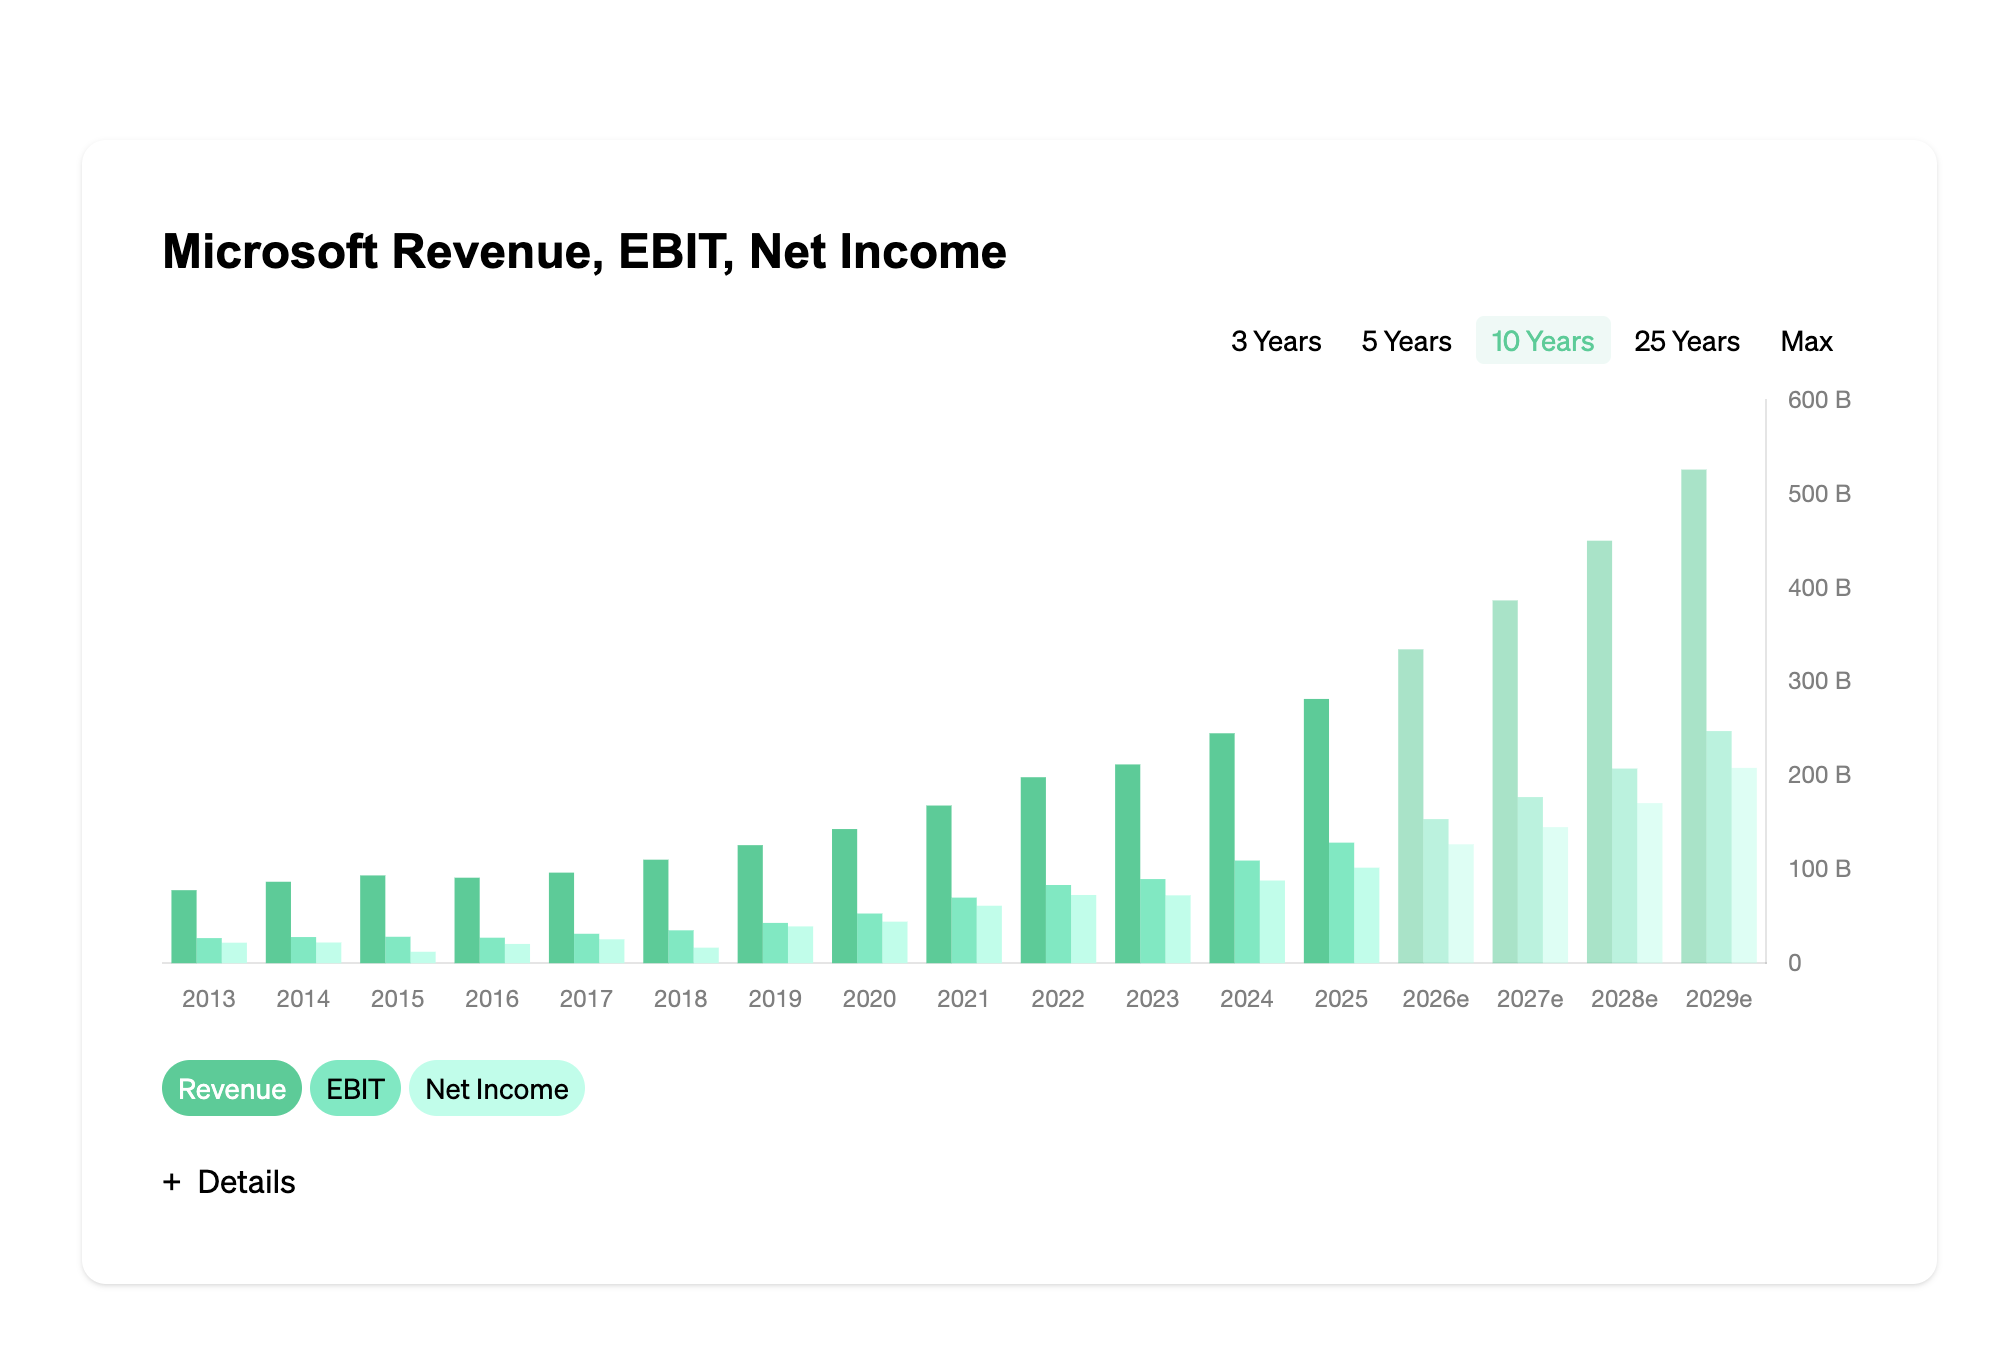
Silver Lake Resources Revenue, EBIT, Net Income
3 Years
5 Years
10 Years
25 Years
Max
Details
Silver Lake Resources Income Statement, Balance Sheet, Cash Flow Statement
| REVENUE (M AUD) |
|---|
| REVENUE GROWTH (%) |
| GROSS MARGIN (%) |
| GROSS INCOME (M AUD) |
| NET INCOME (M AUD) |
| NET INCOME GROWTH (%) |
| SHARES (M) |
| DOCUMENTS |
| 2005 | 2006 | 2007 | 2008 | 2009 | 2010 | 2011 | 2012 | 2013 | 2014 | 2015 | 2016 | 2017 | 2018 | 2019 | 2020 | 2021 | 2022 | 2023 | 2024e | 2025e | 2026e | 2027e |
|---|---|---|---|---|---|---|---|---|---|---|---|---|---|---|---|---|---|---|---|---|---|---|
| 0 | 0 | 0 | 2 | 58 | 69 | 90 | 135 | 215 | 309 | 185 | 209 | 227 | 255 | 301 | 563 | 598 | 634 | 719 | 740 | 751 | 896 | 732 |
| – | – | – | – | 2,800.00 | 18.97 | 30.43 | 50.00 | 59.26 | 43.72 | -40.13 | 12.97 | 8.61 | 12.33 | 18.04 | 87.04 | 6.22 | 6.02 | 13.41 | 2.92 | 1.49 | 19.31 | -18.30 |
| – | – | – | -100.00 | 25.86 | 26.09 | 27.78 | 35.56 | -12.56 | -7.12 | 4.32 | 8.13 | 4.85 | 11.37 | 9.63 | 29.13 | 27.09 | 18.30 | 11.13 | 10.81 | 10.65 | 8.93 | 10.93 |
| 0 | 0 | 0 | -2 | 15 | 18 | 25 | 48 | -27 | -22 | 8 | 17 | 11 | 29 | 29 | 164 | 162 | 116 | 80 | 0 | 0 | 0 | 0 |
| 0 | 0 | 0 | -3 | 10 | 11 | 15 | 31 | -319 | -170 | -94 | 4 | 2 | 16 | 6 | 256 | 98 | 77 | 30 | 100 | 121 | 160 | 78 |
| – | – | – | – | -433.33 | 10.00 | 36.36 | 106.67 | -1,129.03 | -46.71 | -44.71 | -104.26 | -50.00 | 700.00 | -62.50 | 4,166.67 | -61.72 | -21.43 | -61.04 | 233.33 | 21.00 | 32.23 | -51.25 |
| 153.4 | 153.4 | 153.4 | 107.8 | 154.2 | 189.3 | 199.6 | 214.4 | 305.7 | 448.4 | 503.23 | 507.94 | 510.47 | 512.21 | 586.22 | 834.76 | 888.16 | 912.13 | 944.62 | 0 | 0 | 0 | 0 |
| – | – | – | – | – | – | – | – | – | – | – | – | – | – | – | – | – | – | – | – | – | – | – |
Details
Keystats
ⓘRevenue and Growth
The Silver Lake Resources Revenue and Revenue Growth are pivotal to understanding the company's financial health and operational efficiency. A consistent increase in revenue indicates a company’s ability to effectively market and sell its products or services, while the revenue growth percentage offers insights into the pace at which the company is expanding over the years.
Gross Margin
The Gross Margin is a crucial metric that showcases the percentage of revenue exceeding the cost of goods sold (COGS). A higher gross margin is indicative of a company’s efficiency in controlling its production costs, thereby promising potential profitability and financial stability.
EBIT and EBIT Margin
EBIT (Earnings Before Interest and Taxes) and EBIT Margin offer deep insights into a company’s profitability, excluding the impacts of interest and taxes. Investors often assess these metrics to gauge the operational efficiency and inherent profitability of a business, separate from its financial structure and tax environment.
Income and Growth
Net Income and its subsequent growth are quintessential for investors looking to understand a company’s profitability. Consistent income growth underscores a company’s ability to enhance its profitability over time, reflecting operational efficiency, strategic competitiveness, and financial health.
Shares Outstanding
Shares outstanding refer to the total number of shares a company has issued. It's instrumental in calculating key metrics like Earnings Per Share (EPS) which is pivotal for investors to evaluate a company’s profitability on a per-share basis, offering a more granular view of financial health and valuation.
Interpreting Year to Year Comparison
Comparing yearly data allows investors to identify trends, assess the company’s growth, and anticipate potential future performance. Analyzing how metrics like revenue, income, and margins change year over year can provide valuable insights into the company’s operational efficiency, competitiveness, and overall financial health.
Expectations and Predictions
Investors often juxtapose the current and past financial data with the market’s expectations. This comparison aids in assessing whether the Silver Lake Resources is performing as anticipated, underperforming or outperforming the market predictions, providing pivotal data for investment decisions.
Silver Lake Resources Stock Quarterly Figures
| REVENUE (M AUD) |
|---|
| REVENUE GROWTH (%) |
| GROSS MARGIN (%) |
| GROSS INCOME (M AUD) |
| NET INCOME (M AUD) |
| NET INCOME GROWTH (%) |
| SHARES (M) |
| 2007 Q2 | 2007 Q4 | 2008 Q2 | 2008 Q4 | 2009 Q2 | 2009 Q4 | 2010 Q2 | 2010 Q4 | 2011 Q2 | 2011 Q4 | 2012 Q2 | 2012 Q4 | 2013 Q2 | 2013 Q4 | 2014 Q2 | 2014 Q4 | 2015 Q2 | 2015 Q4 | 2016 Q2 | 2016 Q4 | 2017 Q2 | 2017 Q4 | 2018 Q2 | 2018 Q4 | 2019 Q2 | 2019 Q4 | 2020 Q2 | 2020 Q4 | 2021 Q2 | 2021 Q4 | 2022 Q2 | 2022 Q4 | 2023 Q1 | 2023 Q2 | 2023 Q3 | 2023 Q4 | 2024 Q2 |
|---|---|---|---|---|---|---|---|---|---|---|---|---|---|---|---|---|---|---|---|---|---|---|---|---|---|---|---|---|---|---|---|---|---|---|---|---|
| 0 | 0 | 0 | 2 | 21 | 36 | 25 | 44 | 40 | 49 | 67 | 67 | 85 | 130 | 174 | 135 | 84 | 101 | 105 | 104 | 107 | 120 | 114 | 140 | 119 | 181 | 258 | 304 | 316 | 281 | 307 | 326 | 146 | 292 | 213 | 426 | 374 |
| – | – | – | – | 950.00 | 71.43 | -30.56 | 76.00 | -9.09 | 22.50 | 36.73 | – | 26.87 | 52.94 | 33.85 | -22.41 | -37.78 | 20.24 | 3.96 | -0.95 | 2.88 | 12.15 | -5.00 | 22.81 | -15.00 | 52.10 | 42.54 | 17.83 | 3.95 | -11.08 | 9.25 | 6.19 | -55.21 | 100.00 | -27.05 | 100.00 | -12.21 |
| – | – | – | -100.00 | 338.10 | 38.89 | 12.00 | 34.09 | 22.50 | 30.61 | 38.81 | 32.84 | 34.12 | -43.85 | -0.57 | -14.81 | -3.57 | 11.88 | 7.62 | 7.69 | 8.41 | 1.67 | 7.89 | 14.29 | 10.92 | 8.84 | 24.81 | 32.89 | 31.65 | 21.71 | 24.76 | 11.96 | 48.63 | -0.34 | 19.25 | 19.25 | 18.98 |
| 0 | 0 | 0 | -2 | 0 | 14 | 3 | 15 | 9 | 15 | 26 | 22 | 29 | -57 | -1 | -20 | -3 | 12 | 8 | 8 | 9 | 2 | 9 | 20 | 13 | 16 | 64 | 100 | 100 | 61 | 76 | 39 | 0 | -1 | 41 | 82 | 71 |
| 0 | 0 | 0 | -3 | 0 | 10 | 1 | 10 | 6 | 9 | 17 | 14 | 5 | -324 | -47 | -123 | -14 | -79 | 0 | 4 | 8 | -6 | 2 | 14 | 4 | 2 | 44 | 212 | 65 | 32 | 44 | 33 | -7 | -14 | 22 | 45 | 49 |
| – | – | – | – | – | – | -90.00 | 900.00 | -40.00 | 50.00 | 88.89 | -17.65 | -64.29 | -6,580.00 | -85.49 | 161.70 | -88.62 | 464.29 | – | – | 100.00 | -175.00 | -133.33 | 600.00 | -71.43 | -50.00 | 2,100.00 | 381.82 | -69.34 | -50.77 | 37.50 | -25.00 | -121.21 | 100.00 | -257.14 | 104.55 | 8.89 |
| 153.4 | 153.4 | 153.4 | 62.2 | 153.4 | 155.1 | 180.5 | 198.1 | 199.8 | 220.5 | 203 | 220.3 | 233.7 | 386 | 416.6 | 480.2 | 503.2 | 503.2 | 495 | 520.9 | 506.7 | 503.8 | 503.71 | 520.7 | 513.08 | 659.37 | 833.55 | 826.37 | 887.89 | 888.43 | 893.09 | 931.17 | 931.89 | 931.89 | 957.35 | 957.35 | 962.75 |
Details
Keystats
ⓘRevenue and Growth
The Silver Lake Resources Revenue and Revenue Growth are pivotal to understanding the company's financial health and operational efficiency. A consistent increase in revenue indicates a company’s ability to effectively market and sell its products or services, while the revenue growth percentage offers insights into the pace at which the company is expanding over the years.
Gross Margin
The Gross Margin is a crucial metric that showcases the percentage of revenue exceeding the cost of goods sold (COGS). A higher gross margin is indicative of a company’s efficiency in controlling its production costs, thereby promising potential profitability and financial stability.
EBIT and EBIT Margin
EBIT (Earnings Before Interest and Taxes) and EBIT Margin offer deep insights into a company’s profitability, excluding the impacts of interest and taxes. Investors often assess these metrics to gauge the operational efficiency and inherent profitability of a business, separate from its financial structure and tax environment.
Income and Growth
Net Income and its subsequent growth are quintessential for investors looking to understand a company’s profitability. Consistent income growth underscores a company’s ability to enhance its profitability over time, reflecting operational efficiency, strategic competitiveness, and financial health.
Shares Outstanding
Shares outstanding refer to the total number of shares a company has issued. It's instrumental in calculating key metrics like Earnings Per Share (EPS) which is pivotal for investors to evaluate a company’s profitability on a per-share basis, offering a more granular view of financial health and valuation.
Interpreting Year to Year Comparison
Comparing yearly data allows investors to identify trends, assess the company’s growth, and anticipate potential future performance. Analyzing how metrics like revenue, income, and margins change year over year can provide valuable insights into the company’s operational efficiency, competitiveness, and overall financial health.
Expectations and Predictions
Investors often juxtapose the current and past financial data with the market’s expectations. This comparison aids in assessing whether the Silver Lake Resources is performing as anticipated, underperforming or outperforming the market predictions, providing pivotal data for investment decisions.
Silver Lake Resources stock margins
3 Years
5 Years
10 Years
25 Years
Max
Details
Silver Lake Resources Stock Sales Revenue, EBIT, Earnings per Share
3 Years
5 Years
10 Years
25 Years
Max
Details
Silver Lake Resources business model
Silver Lake Resources SWOT Analysis
Strengths
Silver Lake Resources Ltd has several strengths that contribute to its success in the market:
- Strong financial performance and revenue growth
- Diversified portfolio of mining assets
- Efficient and effective operations management
- Experienced and skilled workforce
- Established brand reputation
Weaknesses
Despite its strengths, Silver Lake Resources Ltd has weaknesses that can pose challenges:
- Dependence on commodity prices, which can be volatile
- Limited geographical presence and market reach
- Potential environmental and social impact concerns
- Reliance on third-party suppliers
- Regulatory and compliance risks
Opportunities
Silver Lake Resources Ltd can explore the following opportunities to enhance its business:
- Expansion into new markets and regions
- Investment in research and development for technological advancements
- Strategic partnerships and collaborations
- Increasing demand for precious metals
- Exploration and acquisition of new mining assets
Threats
Silver Lake Resources Ltd should be wary of the following threats that could impact its business:
- Fluctuating global economic conditions
- Increased competition within the mining industry
- Stringent government regulations and compliance requirements
- Volatility in commodity prices
- Geopolitical and socio-economic uncertainties
Silver Lake Resources Eulerpool Fair Value
Details
Fair Value
ⓘUnderstanding Fair Value
The fair value of a stock provides insights into whether the stock is currently undervalued or overvalued. It is calculated based on profit, revenue, or dividends and offers a comprehensive perspective of the stock’s intrinsic value.
Income-Based Fair Value
This is calculated by multiplying the earnings per share by the average P/E ratio of the selected past years for smoothing. If the fair value is higher than the current market price, it suggests that the stock is undervalued.
Example 2022
Fair Value Profit 2022 = Earnings per Share 2022 / Average P/E Ratio 2019 - 2021 (3 Years Smoothing)
Revenue-Based Fair Value
It is derived by multiplying the revenue per share by the average price-to-sales ratio of the selected past years for smoothing. An undervalued stock is identified if the fair value exceeds the ongoing market price.
Example 2022
Fair Value Revenue 2022 = Revenue per Share 2022 / Average PSR 2019 - 2021 (3 Years Smoothing)
Dividend-Based Fair Value
This value is determined by dividing the dividend per share by the average dividend yield of the selected past years for smoothing. A higher fair value than the market price indicates an undervalued stock.
Example 2022
Fair Value Dividend 2022 = Dividend per Share 2022 * Average Dividend Yield 2019 - 2021 (3 Years Smoothing)
Expectations and Forecasts
Future expectations provide potential trajectories for stock prices and aid investors in decision-making. The expected values are forecasted figures of fair value, taking into account the growth or decline trends of profit, revenue, or dividend.
Comparative Analysis
Comparing the fair value based on profit, revenue, and dividend provides a holistic overview of the stock’s financial health. Observing the annual and per-annual variations contributes to understanding the consistency and reliability of stock performance.
Silver Lake Resources historical P/E ratio, EBIT multiple, and P/S ratio
Details
Historical valuation
ⓘHistorical Price Earnings Ratio (P/E)
The Historical Price Earnings Ratio (P/E) is a key metric that illustrates the relationship between a Silver Lake Resources's share price and its earnings per share (EPS). It helps investors understand how much they are paying for a company’s earning capacity. A lower P/E ratio might indicate that the stock is undervalued, while a higher ratio can suggest overvaluation, all else being equal.
Price to Revenue Ratio (P/R)
The Price to Revenue Ratio (P/R) of Silver Lake Resources is calculated by dividing the current stock price by the revenue per share. This ratio offers insights into the value investors are willing to pay for each dollar of revenue generated. It is especially useful for valuing companies that are not yet profitable or have erratic earnings.
Price to EBIT Ratio (P/EBIT)
The Price to EBIT Ratio compares the Silver Lake Resources's market capitalization to its earnings before interest and taxes (EBIT). This ratio provides insights into a company’s profitability and operational efficiency, excluding the impacts of tax and capital structure. It is a valuable tool for comparing companies in the same industry.
Interpretation and Use
These ratios are integral in assessing a company’s valuation and profitability. Investors utilize these metrics to make informed decisions, comparing Silver Lake Resources’s financial performance and market valuation against historical data, industry averages, and competitors. They aid in identifying potential investment opportunities and risks, contributing to a comprehensive investment strategy.
Silver Lake Resources annual returns
Details
Annual Return
ⓘUnderstanding the Rendite Chart
The rendite chart provides a comprehensive view of the annual return on investment for . It is divided into two parts - stock price rendite and dividend rendite, offering insights into the overall performance and profitability of the investment.
Stock Price Rendite
This section represents the annual return due to the appreciation or depreciation of the 's stock price. Analyzing this data can help investors understand the stock’s historical performance and predict future trends.
Dividend Rendite
Dividend rendite showcases the percentage return on investment from dividends paid out by . It is a key indicator for investors looking for income generation in addition to stock price appreciation.
Making Investment Decisions
By evaluating both the stock price and dividend rendite, investors can gain insights into the total return on investment. It aids in making informed decisions, balancing between growth and income investment strategies.
Silver Lake Resources shares outstanding
3 Years
5 Years
10 Years
25 Years
Max
Details
Silver Lake Resources Earnings Estimates
| Date | EPS estimate | Revenue Estimate | Quarterly report |
|---|---|---|---|
| 2/21/2022 | 0.05AUD | 0AUD | 2022 Q2 |
| 8/18/2021 | 0.08AUD | 321.75 MAUD | 2021 Q4 |
| 8/19/2020 | 0AUD | 254.76 MAUD | 2020 Q4 |
| 2/27/2014 | -0.01AUD | 0AUD | 2014 Q2 |
EESG©
Eulerpool ESG Scorecard© for the Silver Lake Resources stock
EEnvironment
20
Environment
SSocial
20
Social
GGovernance (Corporate Governance)
4
Governance (Corporate Governance)
The Eulerpool ESG Scorecard© is the strictly copyrighted intellectual property of Eulerpool Research Systems. Any unauthorized use, imitation, or infringement will be actively pursued and may lead to significant legal consequences. For licenses, collaborations, or usage rights, please contact us directly via our contact form. Contact Form to us.
Silver Lake Resources shareholders
| % | Name |
|---|---|
10.44083% | |
5.53807% | |
4.94829% | |
3.62326% | |
1.86005% | |
1.77139% | |
1.44363% | |
1.23117% | |
1.22330% | |
1.17508% |
Silver Lake Resources Executives and Management Board
Mr. Luke Tonkin
(59)Managing Director, Executive Director · since 2013
Mr. David Berg
General Counsel, Company Secretary
Mr. Antony Shepherd
Exploration and Geology Manager
Mr. David Quinlivan
Non-Executive Chairman of the Board
Mr. Kelvin Flynn
Non-Executive Director
Silver Lake Resources Supply Chain
Correlation: how closely stock prices move together
| Name | 1M | 3M | 6M | 1Y | 2Y |
|---|---|---|---|---|---|
SRG Global Supplier | 0,80 | 0,61 | 0,78 | 0,48 | -0,56 |
Macmahon Supplier | 0,65 | 0,61 | 0,35 | -0,51 | 0,37 |
JPMorgan Chase Supplier | 0,50 | -0,45 | -0,62 | -0,57 | -0,79 |
HSBC Holdings Supplier | 0,45 | -0,43 | 0,17 | 0,61 | -0,36 |
Citigroup Supplier | 0,45 | -0,61 | -0,68 | -0,60 | -0,75 |
Bank of New York Mellon Supplier | 0,51 | -0,49 | -0,67 | -0,29 | -0,63 |
Silver Lake Resources Research
SoonDeep-dive analyses, investment theses, and proprietary research — curated by Eulerpool.
Research reports are coming soon
We're building institutional-grade equity research for Silver Lake Resources and thousands of other companies.
Most common questions regarding Silver Lake Resources
The business model of Silver Lake Resources Ltd revolves around gold mining and exploration. As an Australian-based company, Silver Lake Resources is committed to identifying and developing gold projects in Western Australia. By leveraging its industry experience and expertise, the company focuses on extracting and processing gold ores to ultimately sell the precious metal. With a strong emphasis on sustainable mining practices, Silver Lake Resources aims to deliver significant value for its shareholders by efficiently operating multiple mines and continuously exploring new opportunities for growth in the gold mining sector.
Silver Lake Resources stock
Silver Lake Resources Peer Group
Silver Lake Resources Ticker
Silver Lake Resources FIGI
All fundamentals about Silver Lake Resources
Our stock analysis for Silver Lake Resources Revenue stock includes important financial indicators such as revenue, profit, P/E ratio, P/S ratio, EBIT, as well as information on dividends. We also assess aspects such as stocks, market capitalization, debt, equity, and liabilities of Silver Lake Resources Revenue. If you are looking for more detailed information on these topics, we offer comprehensive analyses on our subpages.
- Silver Lake Resources Revenue
- Silver Lake Resources Net Income
- Silver Lake Resources P/E
- Silver Lake Resources P/S
- Silver Lake Resources EBIT
- Silver Lake Resources Dividend
- Silver Lake Resources Directors Dealings
- Silver Lake Resources Stocks
- Silver Lake Resources Market capitalization
- Silver Lake Resources Debt
- Silver Lake Resources Liabilities
- Silver Lake Resources Equity
- Silver Lake Resources AAQS
- Silver Lake Resources Employees
- Silver Lake Resources ROE
- Silver Lake Resources ROA
- Silver Lake Resources ROCE