AMA Group (AMA.AX) Stock Price
Price
AMA Group stock price
Details
Stock Price
ⓘHow to Read This Chart
This chart tracks the historical stock price of AMA Group over time. You can switch between daily, weekly, and monthly views and select custom time ranges — from a single day to the full available history. Use the toggle to view price changes in absolute currency terms or as a percentage change relative to the starting date.
Total Return vs. Price Return
The "Total Return" toggle includes reinvested dividends on top of the pure price movement. This is critical because dividends can account for a significant portion of long-term returns. Historically, roughly 40 % of the S&P 500's total return has come from dividends. Always compare total return when evaluating a stock's real performance against a benchmark.
Intraday Price Data
When viewing a one-day time frame, the chart displays real-time intraday price movements. This is useful for observing how AMA Group stock reacts to market openings, earnings releases, or breaking news throughout the trading session.
What to Look For
Look for long-term trends (sustained upward or downward movements over months and years), support and resistance levels (price zones where the stock repeatedly bounces or reverses), and volatility (how much the price fluctuates day to day). Comparing AMA Group's price chart to a market index like the S&P 500 can reveal whether the stock is outperforming or underperforming the broader market.
| Date | AMA Group Price |
|---|---|
| 2/20/2026 | 0.73 AUD |
| 2/19/2026 | 0.73 AUD |
| 2/18/2026 | 0.73 AUD |
| 2/17/2026 | 0.73 AUD |
| 2/16/2026 | 0.76 AUD |
| 2/13/2026 | 0.74 AUD |
| 2/12/2026 | 0.76 AUD |
| 2/11/2026 | 0.76 AUD |
| 2/10/2026 | 0.75 AUD |
| 2/9/2026 | 0.74 AUD |
| 2/6/2026 | 0.74 AUD |
| 2/5/2026 | 0.74 AUD |
| 2/4/2026 | 0.73 AUD |
| 2/3/2026 | 0.73 AUD |
| 2/2/2026 | 0.75 AUD |
| 1/30/2026 | 0.75 AUD |
| 1/29/2026 | 0.77 AUD |
| 1/28/2026 | 0.79 AUD |
| 1/27/2026 | 0.77 AUD |
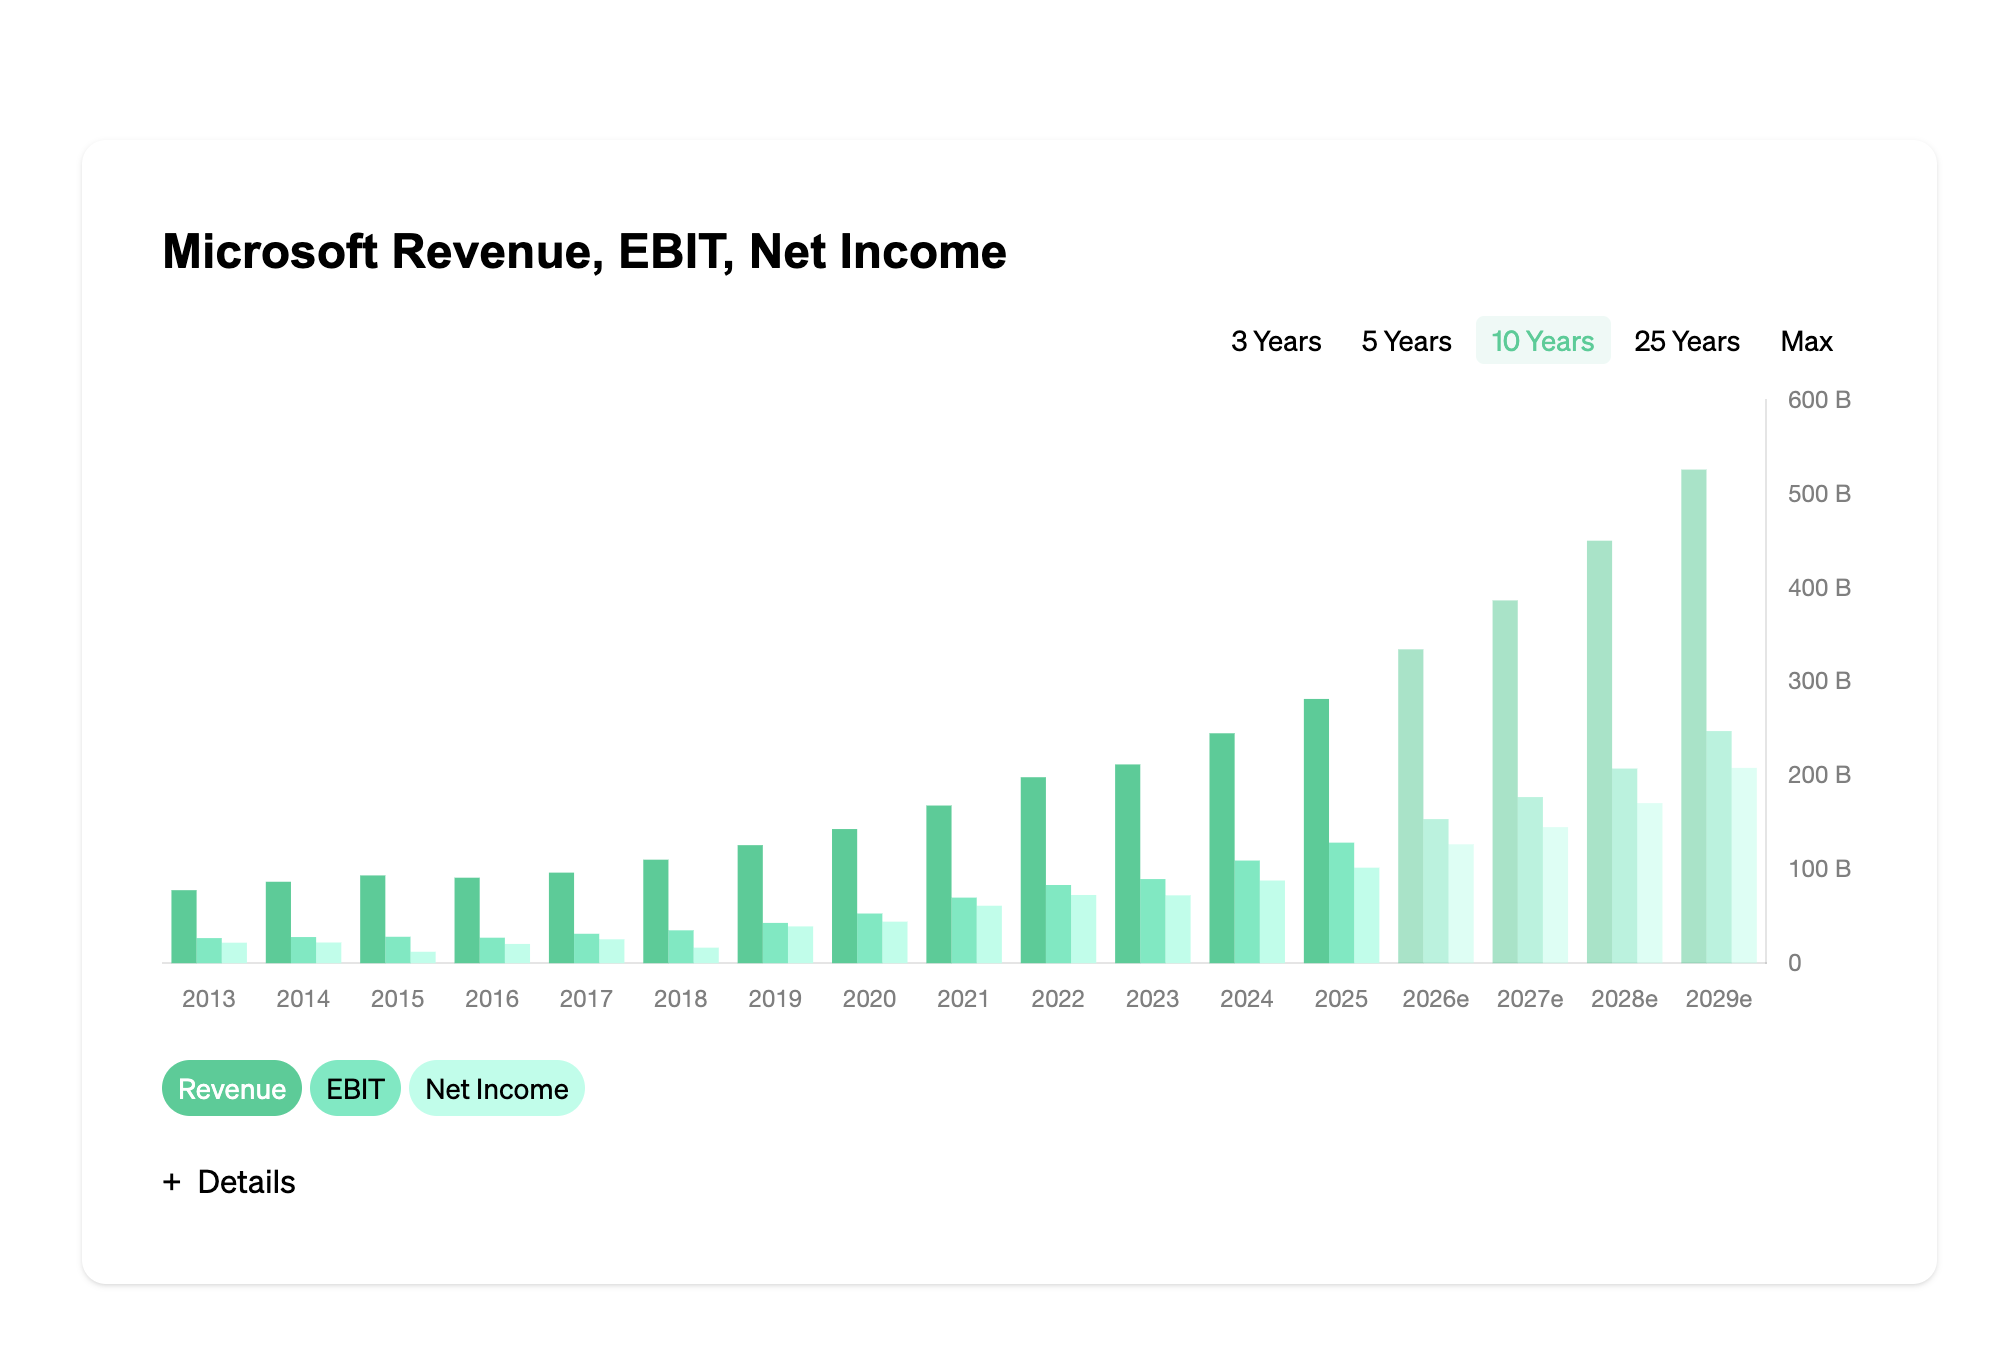
AMA Group Revenue, EBIT, Net Income
3 Years
5 Years
10 Years
25 Years
Max
Details
AMA Group Income Statement, Balance Sheet, Cash Flow Statement
| REVENUE (B AUD) |
|---|
| REVENUE GROWTH (%) |
| GROSS MARGIN (%) |
| GROSS INCOME (M AUD) |
| NET INCOME (M AUD) |
| NET INCOME GROWTH (%) |
| SHARES (M) |
| DOCUMENTS |
| 2006 | 2007 | 2008 | 2009 | 2010 | 2011 | 2012 | 2013 | 2014 | 2015 | 2016 | 2017 | 2018 | 2019 | 2020 | 2021 | 2022 | 2023 | 2024 | 2025 | 2026e | 2027e | 2028e |
|---|---|---|---|---|---|---|---|---|---|---|---|---|---|---|---|---|---|---|---|---|---|---|
| 0 | 0.04 | 0.08 | 0.05 | 0.05 | 0.05 | 0.06 | 0.06 | 0.06 | 0.09 | 0.26 | 0.38 | 0.51 | 0.61 | 0.83 | 0.92 | 0.84 | 0.83 | 0.93 | 1.01 | 1.07 | 1.13 | 1.17 |
| – | 3,500.00 | 119.44 | -43.04 | 13.33 | 3.92 | 16.98 | 3.23 | – | 45.31 | 183.87 | 44.70 | 32.72 | 19.53 | 36.14 | 11.39 | -8.16 | -1.66 | 12.41 | 8.57 | 5.82 | 5.04 | 3.73 |
| 18,000.00 | 27.78 | 29.11 | 15.56 | 29.41 | 28.30 | 27.42 | 25.00 | 25.00 | 25.81 | 20.45 | 20.16 | 18.74 | 18.98 | 12.85 | 15.23 | 9.48 | 12.53 | 16.08 | 17.77 | 16.79 | 15.99 | 15.41 |
| 0 | 10 | 23 | 7 | 15 | 15 | 17 | 16 | 16 | 24 | 54 | 77 | 95 | 115 | 106 | 140 | 80 | 104 | 150 | 180 | 0 | 0 | 0 |
| -1 | 3 | 6 | -59 | 4 | 12 | 7 | 7 | 5 | 9 | 6 | 17 | 15 | 21 | -70 | -96 | -144 | -144 | -7 | -7 | 17 | 24 | 31 |
| – | -400.00 | 100.00 | -1,083.33 | -106.78 | 200.00 | -41.67 | – | -28.57 | 80.00 | -33.33 | 183.33 | -11.76 | 40.00 | -433.33 | 37.14 | 50.00 | – | -95.14 | – | -342.86 | 41.18 | 29.17 |
| 1.45 | 10.79 | 17.24 | 18.15 | 31.83 | 36.71 | 37.66 | 40.55 | 44.42 | 44.08 | 61.76 | 70.94 | 71.68 | 84.55 | 92.41 | 96.42 | 121.25 | 136.18 | 162.34 | 439.35 | 0 | 0 | 0 |
| – | – | – | – | – | – | – | – | – | – | – | – | – | – | – | – | – | – | – | – | – | – | – |
Details
Income Statement Key Figures
ⓘRevenue and Revenue Growth
Revenue is the starting point of every income statement — it measures the total sales AMA Group generates from its core business. Revenue growth (expressed as year-over-year percentage change) is one of the most important indicators of business momentum. Sustained growth above 10 % annually is generally considered strong, while declining revenue is a serious warning sign that demands investigation.
Gross Margin
Gross margin = (Revenue − Cost of Goods Sold) ÷ Revenue. It reveals what percentage of each dollar of revenue AMA Group retains after direct production costs. High gross margins (above 50 %) are typical of asset-light businesses like software and brands, while capital-intensive industries like manufacturing often operate below 30 %. Compare AMA Group's gross margin to industry peers and track it over time to spot improving or deteriorating pricing power.
EBIT and EBIT Margin
EBIT measures operating profit — what remains after subtracting all operating expenses (including R&D, sales, and administrative costs) from gross profit. The EBIT margin shows this as a percentage of revenue. Because it excludes interest and taxes, EBIT allows fair comparisons between companies with different debt levels and tax jurisdictions. A rising EBIT margin indicates improving operational efficiency.
Net Income and Earnings Per Share (EPS)
Net income is the company's final profit after all expenses, interest, and taxes. Dividing net income by the number of shares outstanding gives you EPS — the single most influential metric in stock valuation. Consistent EPS growth is the primary driver of long-term stock price appreciation. Always check whether EPS growth comes from genuine profit improvement or from share buybacks reducing the share count.
Shares Outstanding
The total number of shares AMA Group has issued. A declining share count (through buybacks) boosts EPS and signals management confidence. A rising share count (through stock issuance) dilutes existing shareholders. Always monitor this number alongside EPS to get the full picture of per-share value creation.
Analyst Estimates
The projected figures represent consensus estimates from professional analysts. Compare these forecasts against AMA Group's historical growth rates to assess whether expectations are realistic. A company that consistently beats consensus estimates tends to see its stock price rewarded over time, while repeated misses erode investor confidence.
AMA Group Stock Quarterly Figures
| REVENUE (M AUD) |
|---|
| REVENUE GROWTH (%) |
| GROSS MARGIN (%) |
| GROSS INCOME (M AUD) |
| NET INCOME (M AUD) |
| NET INCOME GROWTH (%) |
| SHARES (B) |
| 2005 QNaN | 2007 Q2 | 2007 Q4 | 2008 Q2 | 2008 Q4 | 2009 Q2 | 2009 Q4 | 2010 Q2 | 2010 Q4 | 2011 Q2 | 2011 Q4 | 2012 Q2 | 2012 Q4 | 2013 Q2 | 2013 Q4 | 2014 Q2 | 2014 Q4 | 2015 Q2 | 2015 Q4 | 2016 Q2 | 2016 Q4 | 2017 Q2 | 2017 Q4 | 2018 Q2 | 2018 Q4 | 2019 Q2 | 2019 Q4 | 2020 Q2 | 2020 Q4 | 2021 Q2 | 2021 Q4 | 2022 Q2 | 2022 Q4 | 2023 Q1 | 2023 Q2 | 2023 Q3 | 2023 Q4 | 2024 Q2 | 2024 Q4 | 2025 Q2 | 2025 Q4 |
|---|---|---|---|---|---|---|---|---|---|---|---|---|---|---|---|---|---|---|---|---|---|---|---|---|---|---|---|---|---|---|---|---|---|---|---|---|---|---|---|---|
| 0 | 13 | 22 | 33 | 45 | 23 | 21 | 24 | 26 | 28 | 25 | 28 | 34 | 33 | 31 | 30 | 33 | 42 | 50 | 106 | 158 | 179 | 202 | 228 | 279 | 298 | 308 | 364 | 461 | 435 | 484 | 418 | 426 | 213 | 426 | 221 | 404 | 451 | 481 | 472 | 541 |
| – | – | 69.23 | 50.00 | 36.36 | -48.89 | -8.70 | 14.29 | 8.33 | 7.69 | -10.71 | 12.00 | 21.43 | -2.94 | -6.06 | -3.23 | 10.00 | 27.27 | 19.05 | 112.00 | 49.06 | 13.29 | 12.85 | 12.87 | 22.37 | 6.81 | 3.36 | 18.18 | 26.65 | -5.64 | 11.26 | -13.64 | 1.91 | -50.00 | 100.00 | -48.12 | 82.81 | 11.63 | 6.65 | -1.87 | 14.62 |
| – | 23.08 | 31.82 | 24.24 | 31.11 | 4.35 | 23.81 | 29.17 | 26.92 | 25.00 | 28.00 | 25.00 | 29.41 | 24.24 | 22.58 | 23.33 | 24.24 | 26.19 | 26.00 | 19.81 | 20.89 | 21.23 | 18.81 | 19.30 | 18.28 | 18.46 | 19.48 | 15.11 | 18.00 | 14.48 | 15.91 | 7.89 | 10.80 | 52.11 | 11.97 | 52.49 | 12.87 | 15.30 | 16.84 | 16.31 | 19.04 |
| 0 | 3 | 7 | 8 | 14 | 1 | 5 | 7 | 7 | 7 | 7 | 7 | 10 | 8 | 7 | 7 | 8 | 11 | 13 | 21 | 33 | 38 | 38 | 44 | 51 | 55 | 60 | 55 | 83 | 63 | 77 | 33 | 46 | 111 | 51 | 116 | 52 | 69 | 81 | 77 | 103 |
| 0 | 1 | 2 | 1 | 4 | -68 | 8 | 1 | 3 | 5 | 6 | 2 | 5 | 3 | 3 | 2 | 3 | 4 | 4 | 3 | 3 | 8 | 8 | 7 | 7 | 9 | 11 | -11 | -58 | 5 | -102 | -46 | -97 | -13 | -25 | -59 | -118 | -10 | 2 | -4 | -3 |
| – | – | 100.00 | -50.00 | 300.00 | -1,800.00 | -111.76 | -87.50 | 200.00 | 66.67 | 20.00 | -66.67 | 150.00 | -40.00 | – | -33.33 | 50.00 | 33.33 | – | -25.00 | – | 166.67 | – | -12.50 | – | 28.57 | 22.22 | -200.00 | 427.27 | -108.62 | -2,140.00 | -54.90 | 110.87 | -86.60 | 92.31 | 136.00 | 100.00 | -91.53 | -120.00 | -300.00 | -25.00 |
| 0 | 0.01 | 0.01 | 0.02 | 0.02 | 0.02 | 0.02 | 0.03 | 0.04 | 0.04 | 0.04 | 0.04 | 0.04 | 0.04 | 0.04 | 0.04 | 0.04 | 0.04 | 0.04 | 0.06 | 0.07 | 0.07 | 0.07 | 0.07 | 0.07 | 0.08 | 0.09 | 0.09 | 0.09 | 0.1 | 0.1 | 0.11 | 0.13 | 0 | 0.14 | 1.07 | 0.14 | 0.22 | 0.11 | 0.43 | 0.45 |
Details
Income Statement Key Figures
ⓘRevenue and Revenue Growth
Revenue is the starting point of every income statement — it measures the total sales AMA Group generates from its core business. Revenue growth (expressed as year-over-year percentage change) is one of the most important indicators of business momentum. Sustained growth above 10 % annually is generally considered strong, while declining revenue is a serious warning sign that demands investigation.
Gross Margin
Gross margin = (Revenue − Cost of Goods Sold) ÷ Revenue. It reveals what percentage of each dollar of revenue AMA Group retains after direct production costs. High gross margins (above 50 %) are typical of asset-light businesses like software and brands, while capital-intensive industries like manufacturing often operate below 30 %. Compare AMA Group's gross margin to industry peers and track it over time to spot improving or deteriorating pricing power.
EBIT and EBIT Margin
EBIT measures operating profit — what remains after subtracting all operating expenses (including R&D, sales, and administrative costs) from gross profit. The EBIT margin shows this as a percentage of revenue. Because it excludes interest and taxes, EBIT allows fair comparisons between companies with different debt levels and tax jurisdictions. A rising EBIT margin indicates improving operational efficiency.
Net Income and Earnings Per Share (EPS)
Net income is the company's final profit after all expenses, interest, and taxes. Dividing net income by the number of shares outstanding gives you EPS — the single most influential metric in stock valuation. Consistent EPS growth is the primary driver of long-term stock price appreciation. Always check whether EPS growth comes from genuine profit improvement or from share buybacks reducing the share count.
Shares Outstanding
The total number of shares AMA Group has issued. A declining share count (through buybacks) boosts EPS and signals management confidence. A rising share count (through stock issuance) dilutes existing shareholders. Always monitor this number alongside EPS to get the full picture of per-share value creation.
Analyst Estimates
The projected figures represent consensus estimates from professional analysts. Compare these forecasts against AMA Group's historical growth rates to assess whether expectations are realistic. A company that consistently beats consensus estimates tends to see its stock price rewarded over time, while repeated misses erode investor confidence.
AMA Group stock margins
3 Years
5 Years
10 Years
25 Years
Max
Details
AMA Group Stock Sales Revenue, EBIT, Earnings per Share
3 Years
5 Years
10 Years
25 Years
Max
Details
AMA Group business model
AMA Group SWOT Analysis
Strengths
AMA Group Ltd possesses several key strengths that contribute to its competitive advantage in the market:
- Extensive industry experience and expertise
- Strong network of automotive repair and service centers
- Well-known and trusted brand reputation
- Diversified range of services offered
- Efficient operational processes and systems
Despite its strengths, AMA Group Ltd also faces certain weaknesses that may hinder its growth and market position:
- Dependence on external suppliers for parts and materials
- Reliance on a limited number of major customers
- Impact of economic fluctuations on consumer spending
- Challenges in managing and retaining skilled workforce
- Potential for quality control issues across multiple locations
AMA Group Ltd can leverage the following opportunities to further enhance its market position and profitability:
- Increasing demand for automotive repair and maintenance services
- Exploring new markets and geographic expansion
- Strategic partnerships and acquisitions for expansion
- Integration of advanced technologies for improved efficiency
- Growing focus on sustainability and environmentally friendly practices
AMA Group Ltd should be wary of the following threats that may impact its business operations and performance:
- Intense competition from existing and emerging players
- Changes in government regulations and policies impacting the automotive industry
- Technological advancements disrupting traditional automotive repair processes
- Economic downturns leading to reduced consumer spending
- Fluctuating costs of raw materials and resources
Weaknesses
Despite its strengths, AMA Group Ltd also faces certain weaknesses that may hinder its growth and market position:
- Dependence on external suppliers for parts and materials
- Reliance on a limited number of major customers
- Impact of economic fluctuations on consumer spending
- Challenges in managing and retaining skilled workforce
- Potential for quality control issues across multiple locations
AMA Group Ltd can leverage the following opportunities to further enhance its market position and profitability:
- Increasing demand for automotive repair and maintenance services
- Exploring new markets and geographic expansion
- Strategic partnerships and acquisitions for expansion
- Integration of advanced technologies for improved efficiency
- Growing focus on sustainability and environmentally friendly practices
AMA Group Ltd should be wary of the following threats that may impact its business operations and performance:
- Intense competition from existing and emerging players
- Changes in government regulations and policies impacting the automotive industry
- Technological advancements disrupting traditional automotive repair processes
- Economic downturns leading to reduced consumer spending
- Fluctuating costs of raw materials and resources
Opportunities
AMA Group Ltd can leverage the following opportunities to further enhance its market position and profitability:
- Increasing demand for automotive repair and maintenance services
- Exploring new markets and geographic expansion
- Strategic partnerships and acquisitions for expansion
- Integration of advanced technologies for improved efficiency
- Growing focus on sustainability and environmentally friendly practices
AMA Group Ltd should be wary of the following threats that may impact its business operations and performance:
- Intense competition from existing and emerging players
- Changes in government regulations and policies impacting the automotive industry
- Technological advancements disrupting traditional automotive repair processes
- Economic downturns leading to reduced consumer spending
- Fluctuating costs of raw materials and resources
Threats
AMA Group Ltd should be wary of the following threats that may impact its business operations and performance:
- Intense competition from existing and emerging players
- Changes in government regulations and policies impacting the automotive industry
- Technological advancements disrupting traditional automotive repair processes
- Economic downturns leading to reduced consumer spending
- Fluctuating costs of raw materials and resources
AMA Group Eulerpool Fair Value
Details
Fair Value Estimate
ⓘWhat Is Fair Value?
Fair value is an estimate of what a stock is truly "worth" based on its financial fundamentals, independent of the current market price. If the calculated fair value is above the current share price, the stock may be undervalued — and vice versa. This chart shows three different fair value approaches so you can cross-check them against each other.
Earnings-Based Fair Value
Calculated by multiplying the current earnings per share (EPS) by the average historical P/E ratio over a selected multi-year period. The smoothing over several years filters out temporary spikes or dips. If this fair value exceeds the market price, it suggests the stock is cheap relative to its earning power.
Example: Fair Value (Earnings) 2022 = EPS 2022 × Average P/E 2019–2021
Revenue-Based Fair Value
Derived by multiplying revenue per share by the average historical price-to-sales ratio. This method is particularly useful for companies with volatile or temporarily depressed earnings, as revenue tends to be more stable than profits. It answers: "At what price has the market historically valued each dollar of this company's sales?"
Example: Fair Value (Revenue) 2022 = Revenue per Share 2022 × Average P/S 2019–2021
Dividend-Based Fair Value
Calculated by dividing the dividend per share by the average historical dividend yield. This approach is most relevant for mature, consistently dividend-paying companies. If the resulting fair value is higher than the current price, it implies the stock offers a better yield than its historical average.
Example: Fair Value (Dividend) 2022 = Dividend per Share 2022 ÷ Average Yield 2019–2021
How to Use This Chart
When all three fair value lines converge above the current price, it strengthens the case that the stock is undervalued. When they diverge, investigate why — it may indicate a structural shift in margins, payout policy, or growth rate. The forward estimates on the right extend the analysis using projected fundamentals, helping you assess whether the current price already reflects future growth expectations.
AMA Group historical P/E ratio, EBIT multiple, and P/S ratio
AMA Group annual returns
Details
Annual Return
ⓘWhat This Chart Shows
This chart breaks down 's total annual return into two components: price return (gains or losses from stock price movement) and dividend return (income received from dividend payments). Together, they represent the total return an investor would have earned in each calendar year.
Price Return
Price return measures the percentage change in 's stock price from January 1st to December 31st of each year. Positive bars indicate the stock appreciated; negative bars show a decline. This is the component most investors focus on, but it tells only part of the story — especially for dividend-paying stocks.
Dividend Return
Dividend return represents the income generated from dividends paid during the year, expressed as a percentage of the starting stock price. While it may seem small in any single year (typically 1–4 % for established companies), dividends compound significantly over decades and have historically contributed roughly 40 % of total stock market returns.
What to Look For
Examine how many years showed positive vs. negative returns to gauge consistency. A stock with mostly positive years and small drawdowns suggests lower risk. Also compare 's annual returns to a benchmark index — consistently outperforming the market is a hallmark of a strong investment. Pay attention to the worst years: understanding downside risk is just as important as chasing upside potential.
AMA Group shares outstanding
3 Years
5 Years
10 Years
25 Years
Max
Details
AMA Group stock splits
AMA Group Dividend History
10 years of dividend payments
AMA Group dividend history and estimates
Max
Details
AMA Group dividend payout ratio
3 Years
5 Years
10 Years
25 Years
Max
Details
Current AMA Group forecasts and price targets in February 2026
| Δ MOM Price Target | 0 % |
| Buy | 85.71 % (6) |
| Hold | 14.29 % (1) |
| Sell | 0 % (0) |
| 12M Price Target | 1.33 |
| Last Price | 0.06 |
| Currency | AUD |
| 12M Return Potential | 2,049.11 % |
| LTM Return | 0 % |
EESG©
Eulerpool ESG Scorecard© for the AMA Group stock
EEnvironment
20
Environment
SSocial
20
Social
GGovernance (Corporate Governance)
4
Governance (Corporate Governance)
The Eulerpool ESG Scorecard© is the strictly copyrighted intellectual property of Eulerpool Research Systems. Any unauthorized use, imitation, or infringement will be actively pursued and may lead to significant legal consequences. For licenses, collaborations, or usage rights, please contact us directly via our contact form. Contact Form to us.
AMA Group shareholders
| % | Name |
|---|---|
158.07655% | |
73.18769% | |
52.27649% | |
48.71715% | |
38.96698% | |
26.78862% | |
21.77455% | |
19.28481% | |
18.18735% | |
16.29870% |
AMA Group Executives and Management Board
Mr. Mathew Cooper
Group Chief Executive Officer
Mr. Brian Austin
Non-Executive Independent Chairman of the Board
Mr. David Goldstein
Non-Executive Independent Director
Mr. Raymond Smith-Roberts
Non-Executive Independent Director
Ms. Joanne Dawson
Non-Executive Independent Director
AMA Group Supply Chain
Correlation: how closely stock prices move together
| # | Name | 1M | 3M | 6M | 1Y | 2Y | Trend |
|---|---|---|---|---|---|---|---|
| 1 | -0,30 | -0,39 | -0,39 | 0,49 | 0,43 | ||
| 2 | -0,68 | -0,59 | 0,55 | 0,70 | 0,34 |
| # | Name | 1M | 3M | 6M | 1Y | 2Y | Trend |
|---|---|---|---|---|---|---|---|
| 1 | -0,58 | -0,45 | -0,17 | -0,66 | -0,82 | ||
| 2 | -0,42 | -0,62 | -0,09 | -0,34 | -0,80 | ||
| 3 | 0,39 | -0,14 | -0,69 | -0,74 | -0,73 | ||
| 4 | Tata Motors | 0,63 | 0,57 | 0,83 | -0,32 | -0,70 | |
| 5 | -0,74 | -0,66 | -0,06 | 0,46 | -0,62 |
AMA Group Research
SoonDeep-dive analyses, investment theses, and proprietary research — curated by Eulerpool.
Research reports are coming soon
We're building institutional-grade equity research for AMA Group and thousands of other companies.
Most common questions regarding AMA Group
AMA Group Ltd operates in the automotive aftercare and accessories market. The company provides a wide range of services, including smash repairs, panel beating, automotive parts manufacturing, and vehicle logistics. AMA Group works through various subsidiaries that specialize in different segments of the automotive industry. With a focus on delivering high-quality products and services, AMA Group aims to meet the needs of both individual customers and insurance companies. By combining expertise, innovation, and a customer-centric approach, AMA Group strives to maintain a strong position in the automotive aftercare industry.
AMA Group stock
AMA Group Peer Group
AMA Group Ticker
AMA Group FIGI
All fundamentals about AMA Group
Our stock analysis for AMA Group Revenue stock includes important financial indicators such as revenue, profit, P/E ratio, P/S ratio, EBIT, as well as information on dividends. We also assess aspects such as stocks, market capitalization, debt, equity, and liabilities of AMA Group Revenue. If you are looking for more detailed information on these topics, we offer comprehensive analyses on our subpages.